Download
1 / 13
130 likes | 229 Views
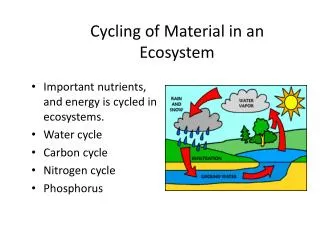
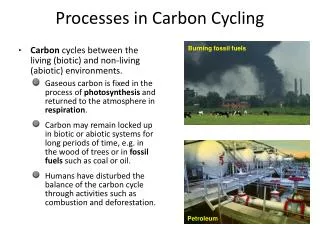
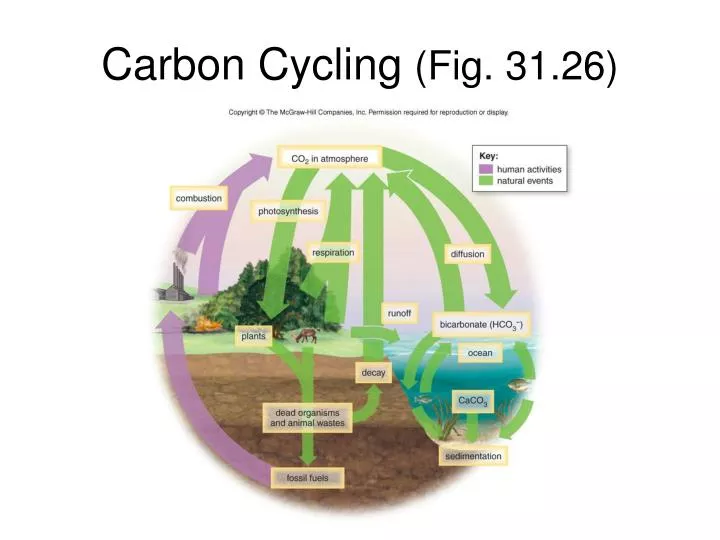
Carbon Cycling (Fig. 31.26). Nitrogen Cycling (Fig. 31.24). Biomes. a). Fish - one hundred. Beetles - one thousand. Daphnia - hundreds of thousands. Protozoa - millions. b). Parasites and predators - tens of thousands. Insect herbivores - thousands. Oak tree - one. c).

E N D
a) Fish - one hundred Beetles - one thousand Daphnia - hundreds of thousands Protozoa - millions b) Parasites and predators - tens of thousands Insect herbivores - thousands Oak tree - one c) Parasites and predators - 100g Herbivores - 5 kg Oak tree - 30 tonnes d) Primary carnivores (pelagic fish) - 1.8 Herbivores (zooplankton) -1.5 Producers (phytoplankton) - 0.4 e) Primary carnivores - 0.0016 Herbivores - 0.15 Producers - 0.4
Seral stage Spruce, Picea sitchensis Dryas 7.0 5.3 7.3 2.8 Spruce 15.1 53.3 3.6 261 Alder 8.8 21.8 6.8 277 Pioneer 5.2 3.8 7.2 1.5 Western hemlock, Tsuga heterophylla Soil depth (cm) Soil N (gm ) Soil pH -2 Litterfall (gm yr ) -2 -1 Liverworts Lichens River beauty Epilobium (rare) Horsetail Equisetum Blue-green algae Cottonwood, Populus trichocarpa Mountain avens, Dryas drummondi Alder, Alnus sinuata Willow, salix 5 200 40 60 Time (years) since retreat of glacier
Global Plant Diversity >5000 species per 104 km <100 species per 104 km