Download

1 / 10
100 likes | 196 Views
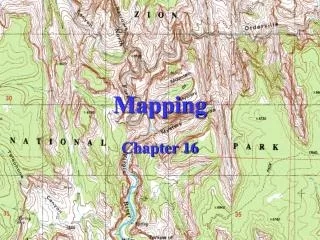
Mapping. Required readings: 18-1 to 18-10 &18-12&18-14, 18-16 and 18-17 Required figures: 18-2, 18-5, 18-6, 18-7, 18-8, 18-10, and 18-12. Mapping. Hard and soft-copy maps Importance for engineers: planning locations, design facilities, and estimate quantities.

E N D
Required readings: 18-1 to 18-10 &18-12&18-14, 18-16 and 18-17 • Required figures: 18-2, 18-5, 18-6, 18-7, 18-8, 18-10, and 18-12
Mapping • Hard and soft-copy maps • Importance for engineers: planning locations, design facilities, and estimate quantities. • Main types: topographic, cadastral, natural resources, facilities, land use, and construction • Cartography: the overall process of map processing. • Scale: large > 1in:100ft, small < 1in:1000ft
Map Production • Computer-aided drafting (CAD): • Knowing point coordinates, using a software a map could be drawn, plotted, and transmitted. • Contour lines are automatically generated from TIN. If desired, cross sections could be established and volumes could be computed. • Some CAD systems designed to export data from total stations • Manual drafting.
Map Components • Border: 1 in on the left side, 1/2 on the rest. • Coordinate system: marked along the border, and TIC marks across the map. • Scale: ratio, equivalence, or graphic (the best). • North arrow. • Legend: explain the symbols. • Title: at lower right corner, state: map type, project name, location, date, scale, and contour intervals. • Notes.
Map Drawing • Planimetric details: compute the coordinates of the points and draw them with respect to the TIC marks. • Contours: first interpolate between known elevations, then connect the required elevations. Interpolation is done by: estimation, proportion, or other techniques. • Contour intervals in meters at scales: 0.5 at 1:500 1 at 1:1000 2 at 1:2000 5 at 1:5000 10 at 1:10,000