Download
1 / 39
390 likes | 576 Views
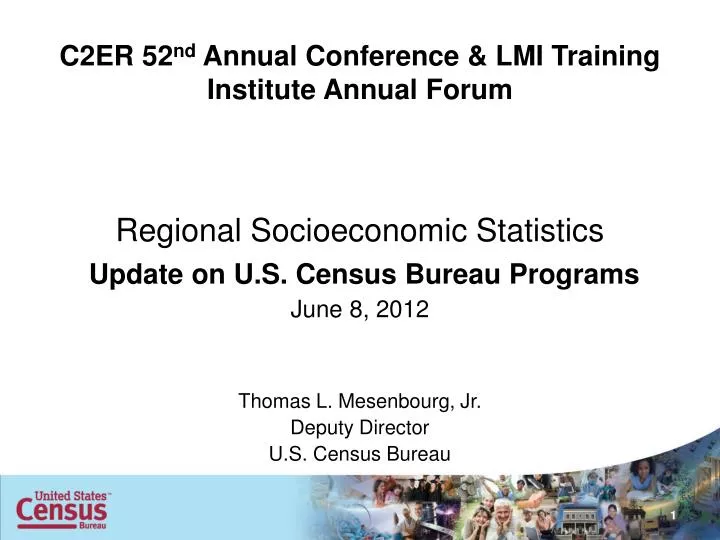
C2ER 52 nd Annual Conference & LMI Training Institute Annual Forum. Regional Socioeconomic Statistics Update on U.S. Census Bureau Programs June 8, 2012 Thomas L. Mesenbourg , Jr. Deputy Director U.S. Census Bureau. AGENDA. FY 13 Budget Update 2010 Census Data Products

E N D
C2ER 52nd Annual Conference & LMI Training Institute Annual Forum Regional Socioeconomic Statistics Update on U.S. Census Bureau Programs June 8, 2012 Thomas L. Mesenbourg, Jr. Deputy Director U.S. Census Bureau
AGENDA • FY 13 Budget Update • 2010 Census Data Products • Population Estimates • 2006-2010 ACS Selected Tables • Local Employment Dynamics Program • Business Dynamics Statistics Program
Impacts of FY 13 House Mark Programs at Risk • American Community Survey • 2012 Economic Census • 2020 Census • 2010 Census Data Products & Evaluations
2010CensusProducts Snapshot of America The Nation, regions, states, counties, places, census tracts, and blocks Diversity: race and ethnicity Composition of families and households Age and sex continuum—babies through elderly Housing tenure and occupancy
Summary File 2: SF2 Files for the 50 States, the District of Columbia, and Puerto Rico were released from December 2011 through April 2012. Provides data down to the census tract level Contains population and housing characteristics iterated for many detailed race and Hispanic or Latino categories
Summary File 2 Contains: Over 300 population groups 74 major race groups 114 American Indian and Alaska Native tribal groupings 47 Asian groups 43 Native Hawaiian and Other Pacific Islander groups 51 Hispanic/not Hispanic groups
Summary File 2 National File United States Regions and Divisions Areas that cross state lines: - American Indian Areas - Core-Based Statistical Areas Released April 2012
Census Briefs The American Indian and Alaska Native Released January 25, 2012 Population: 2010 (C2010BR-10) The Asian Population: 2010 (C2010BR-11) Released March 21, 2012 Households and Families: 2010 Released April 25, 2012 (C2010BR-14) The Hispanic Population: 2010 Released April 30, 2012 (C2010BR-04SP) (Spanish version) The Native Hawaiian and Other Pacific Released May 8, 2012 Islander Population: 2010 (C2010BR-12)
Summary Population and Housing Characteristics Report Series(CPH-1) Release Underway Tables on age, sex, race, Hispanic origin, households, families, housing tenure and occupancy, population density, and area measurements Reports for each state, the District of Columbia, Puerto Rico, and a U.S. Summary May 2012 through December 2012
Preparation Underway Population and Housing Unit Counts Report Series (CPH-2) Selected historical population and housing counts, population density, and area measurements Data for 1990, 2000, and 2010 will be shown Lowest level of geography is place level A report will be produced for each state, the District of Columbia, Puerto Rico, and a U.S. Summary Preparing to release June – September 2012
Preparation Underway Summary File 1 Urban/Rural Update Provides federal, state, local and tribal governments new urban and rural population and housing data Includes newly delineated urbanized areas and urban clusters Data will be available down to the block level Preparing to release September 27, 2012
Pending for FY2013 Public Use Microdata Sample Files (PUMS) Scheduled for release in December 2012 – April 2013 Includes ten percent sample of anonymized 2010 microdata records Allows external data users to perform own analyses and design their own tables Lowest level of geography is the PUMA: public use microdata areas are at least 100,000 people
Pending for FY 2013 American Indian and Alaska Native Summary File Scheduled for release in December 2012 Same content as Summary File 2 Provides data for over 1500 American Indian and Alaska Native tribes and tribal groupings that had counts of 100 or more population in the 2010 Census Population and housing characteristics down to the census tract level.
Products At Risk: FY2013 Public Use Microdata Sample (PUMS) Files Summary File 2 Urban/Rural Update Retabulations of the 2010 Census Summary File 1 for 113th Congressional Districts Summary File State Legislative District Summary File Summary File 1 Redefined Core-Based Statistical Areas Update
Population Estimates Release: May 17, 2012 • Estimates for April 1, 2010 to July 1, 2011 • Nation, states, and counties by age, sex, race, and Hispanic origin • Puerto Rico Commonwealth and municipios by age and sex
Minority Population • The minority population includes any person who is not in the category of Non-Hispanic White alone. • In 2011, the minority population of the nation was 114 million people, or 36.6 percent of the total population.
Children Under Age 5 by Race and Hispanic Origin Source: U.S. Census Bureau, Population Division, Vintage 2011 Resident Population Estimates.
Percentage of the Population 18 Years and Younger that is Minority Note: “Minority” is used here to indicate other than non-Hispanic White alone. Source: U.S. Census Bureau, Population Division, Vintage 2011 Resident Population Estimates.
Note: “Minority” is used here to indicate other than non-Hispanic White alone. Source: U.S. Census Bureau, Population Division, Vintage 2011 Resident Population Estimates.
Note: “Minority” is used here to indicate other than non-Hispanic White alone. Source: U.S. Census Bureau, Population Division, Vintage 2011 Resident Population Estimates.
ACS Selected Population Tables 2006-2010 Five Year estimates
2010 Census Race Alone Population Distribution in Oklahoma Source: 2010 Census
2010 Census Race Alone or in Combination Population Distribution in Oklahoma Source: 2010 Census
Percentage Distribution of theAIAN Population in Oklahoma: 2010 483,000 Note: AIAN refers to American Indian and Alaska Native. Source: 2010 Census
Top Five Places with Highest Proportion AIAN Alone or in Combination: 2010* * Places of 100,000 or more total population. Note: AIAN refers to American Indian and Alaska Native. Source: 2010 Census
Note: This represents those with a Bachelor’s degree only. Additional data Is available for other educational attainment levels. Source: 2006-2010 ACS 5-Year Selected Population Tables.
Local Employment Dynamics and OnTheMap for Emergency Management
Where Workers are Employed Within Oklahoma City Where Oklahoma City Workers Live
Worker Flows In, Out, and Within Oklahoma City 2002 Flow Counts
OnTheMap for Emergency Management Hurricane Irene August 27, 2011 Population Workforce 34
Business Dynamics Statistics Program • Includes data from 1976-2010 • BDS shows the importance of new businesses in job creation • Describes business activity by: • Firm size and Firm age • Industry • State Plans for the future • Increased geographic detail: • Metro/Rural by state • Selected MSAs • Increased industry detail • Additional information about enterprises: • Imports/Exports • Intelectual property • Demographics of business owner