Download
1 / 18
180 likes | 303 Views
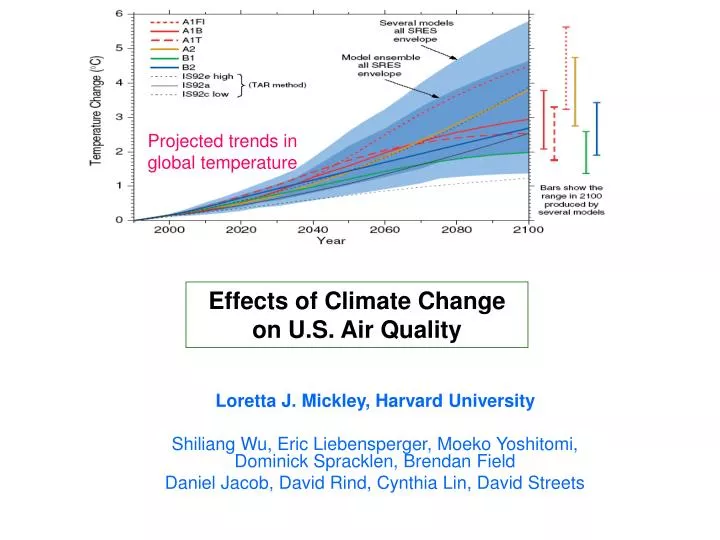
Projected trends in global temperature. Effects of Climate Change on U.S. Air Quality. Loretta J. Mickley, Harvard University Shiliang Wu, Eric Liebensperger, Moeko Yoshitomi, Dominick Spracklen, Brendan Field Daniel Jacob, David Rind, Cynthia Lin, David Streets.

E N D
Projected trends in global temperature Effects of Climate Change on U.S. Air Quality Loretta J. Mickley, Harvard University Shiliang Wu, Eric Liebensperger, Moeko Yoshitomi, Dominick Spracklen, Brendan Field Daniel Jacob, David Rind, Cynthia Lin, David Streets
Number of summer days with ozone exceedances (> 84ppb) over northeast U.S. Average num. of days Probability of ozone exceedance vs. daily max. temperature 1988, hottest on record Day-to-day weather plays a large role in surface air quality (1). Northeast 1992, coldest on record, due to Pinatubo eruption Ozone is strongly correlated with temperature in observations; this is due to (1) chemistry, (2) biogenic VOC emissions, (3) joint association with stagnation. Lin et al., 2001
85-104 ppb 105-124 ppb 3 days later Cold front pushes smog poleward and aloft on a warm conveyor belt. Day-to-day weather plays a large role in surface air quality (2). cyclone EPA ozone levels • Stalled high pressure system increases ozone due to: • increased biogenic emissions • clear skies • weak winds • high temperatures. cold front L cold front L
O2 hn O3 Chemistry of tropospheric ozone STRATOSPHERE What processes will climate change affect? 8-18 km TROPOSPHERE transport hn NO2 NO O3 hn, H2O OH HO2 H2O2 Deposition CO, VOC generally limiting Nitrogen oxide radicals; NOx = NO + NO2 combustion, soils, lightning Methane wetlands, livestock, natural gas Nonmethane volatile organic compounds (NMVOCs) vegetation, combustion, industry CO (carbon monoxide) combustion, VOC oxidation Tropospheric ozone precursors
A decrease in cyclone frequency across mid-latitudes has been observed (and calculated) for recent decades. Calculated trend in summer cyclone frequency, from GISS 2x2.5 GCM, 23 layers Observed trend in winter cyclone frequency over Northern Hemisphere. McCabe et al., 2001 • Climate models tend to predict decrease in mid-latitude cyclogenesis in future due to: • decrease in meridional temperature gradient • more efficient poleward transport of latent heat Leibensperger et al., 2007
Ozone exceedances over eastern United States anti-correlate with cyclone frequency over Southern Canada/ Great Lakes region. sample summertime storm tracks, 1979-81 weak correlation Strong anti-correlation NCEP/NCAR reanalysis Correlation of 1980-2006 summertime ozone exceedances with cyclone number in the red and green boxes for each summer.
Cyclone trend from NCEP/NCAR reanalysis would imply large effect on ozone trends. Interannual variability of cyclone frequency and ozone exceedance is highly anticorrelated (r = - 0.64). Observed 1980-2006 trend in summertime cyclone number, 40-50 N Cyclone trend works against improvements in emissions. Number of summertime ozone exceedance days in Northeast dropped from 38 in 1980 to ~8 in 2006, but would have dropped to 0 in absence of cyclone trend. Number of O3 exceedances in Northeast Leibenspergeret al., in prep.
changing greenhouse gases GISS general circulation model 1950 2000 2025 2050 2075 2100 Spin-up Global change and air pollution (GCAP):Five models working together to provide information on climate change impacts MM5 Mesoscale model archive met fields Model for precursor emissions GEOS-CHEM Global chemistry model archive met fields archive chemistry CMAQ Regional chemistry model
Pollution episodes double in duration in 2050s due to decreasing frequency of cyclones ventilating the eastern U.S. July - August GISS GCM simulations for 2050s vs. present-day climate. CO tracer: constant, present-day anthropogenic emissions + sink of present-day OH fields. 2045-2052 1995-2002 Changes at high end of distribution due to 10-20% decrease in summertime cyclogenesis. Fewer cold front passages allow pollutants to build up. Mickley et al., 2004
ppb 2000-2050 A1 climate change increases summertime ozone. Changes in summer 8-h avg. daily maximum ozone from 2000-2050 climate change Higher temperatures, stagnation Increased water vapor sink • Models agree that 2000-2050 climate change will decrease background ozone but increase surface ozone. We find an increase of 3-5 ppb over large regions. • Most but not all models find maximum effect during pollution episodes (up to 10 ppb in ours) due to increased stagnation and higher temperatures. • Most models find significant effects in Northeast/ Midwest. • Many models disagree in Southeast partly due to different mechanisms for oxidation of biogenic isoprene (the dominant VOC precursor) Wu et al., 2008
Effect of 2000-2050 climate change on pollution episodes. Maximum JJA temperatures Maximum JJA 8-h avg ozone Max. 8-hr-avg ozone Increased maximum temperatures during heat waves leads to increased ozone. 99th percentile 2050s climate 2050s 2000s climate Daily maximum temperature (K) 2000s Cumulative probability (%) Midwest 40% decrease in NOx 2050s climate + DNOx Cumulative probability (%) • Amplification of temperatures at extreme due to • soil moisture feedbacks • 17% decreased cyclone frequency. Wu et al., 2008
correlation coefficient R -1 -.5 0 .5 1 We can use ozone-temperature correlations as a test of model sensitivity to climate change, esp in Southeast US Correlations of daily max-8h-avg ozone with daily max temperature in Jun-Aug GCAP model present-day climate (3 years) Regions of strongest correlation in model and observations. Observations (1980-1998) Yoshitomi et al., in progress
Area burned and temperature in Canada over the last century Gillet et al., 2004 EPA wildfire project: How will changing forest fire frequency affect future air quality over the United States? Most of the variability in wildfire frequency is due to year-to-year changes in surface temperatures and precipitation. Forest fires in western US have big impact on particle concentrations and on surface ozone. What will happen next? Dominick Spracklen has developed a fire prediction tool to calculate future area burned using GISS GCM meteorological variables. . . . 2050 and beyond
Results show far: Future 2040-2050 biomass consumption by wildfires over the western United States is ~50% greater than for present-day. Annual total biomass consumed by forest fires, 1996-2055 Plot shows standardized departures from the 1996-2055 mean. Rynda Hudman at Harvard is investigating effect of future forest fires on surface ozone concentrations. Spracklen et al., in progress.
Increased 2050s wildfire activity leads to 3-6 ppb increase in afternoon mean ozone in July over western U.S. JJA surface ozone Biomass burning NOx emissions 2000 Mean of 5 ppbv enhancement due to fires a > 2 SD 2051 [Gg NO] Hudman et al., in progress [ppbv]
Conclusions In the 1980-2006 NCEP/NCAR record, we find a decline in cyclone frequency of -0.15 cyclones/y, which may have limited the efficacy of air pollution regulations. For 2050-2000 A1B climate change, we calculate a10-20% decline in cyclonefrequency, lengthening pollution episodes over Midwest and Northeast. Climate change is expected to degrade U.S. ozone air quality. The summer average daily max-8h ozone increases by 2-5 ppb over large areas due to 2000-2050 climate change with the IPCC A1B scenario. Largest effect is during pollution episodes, when ozone increases by as much as 10 ppb. Summertime ozone concentrations are predicted to increase by 3-6 ppb over parts of western US due to increasing wildfire frequency in the 2050s. Projected trends in global NOx emissions for a range of scenarios.
Isoprene + OH RO2(OH sink) O3 RO + NO2 (O3 formation) Isoprene + O3 M (O3 sink) Why is ozone in the Southeast insensitive to climate change? Isoprene has competing effects on ozone RO2 + NO RONO2 (sink for NOx) O3 Sensitivity test: Isoprene emissions +30% Δ(O3) Isoprene emissions 2000 2050 / 2000 Wu et al., 2008