Download
1 / 83
830 likes | 984 Views
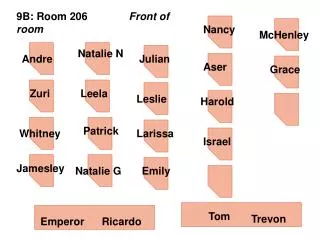
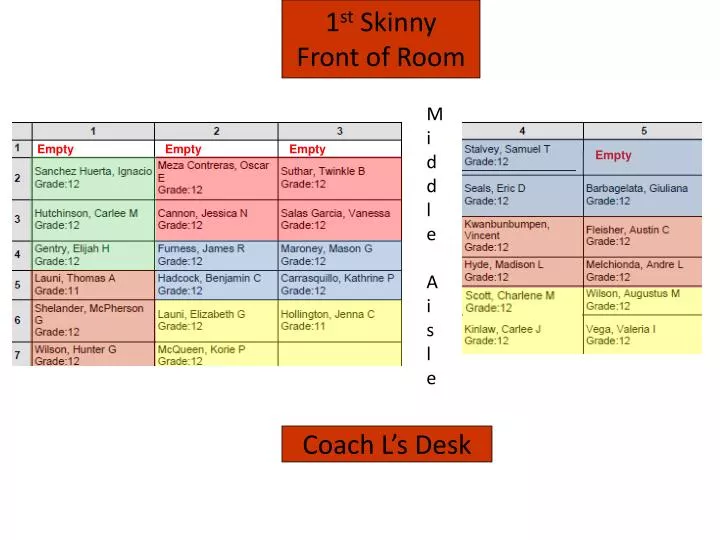
1 st Skinny Front of Room. Middle Aisle. Empty Empty Empty. Empty. Empty Empty. Coach L’s Desk. 2 nd Skinny Front of Room. Middle Aisle. Empty Empty. Empty Empty Empty.

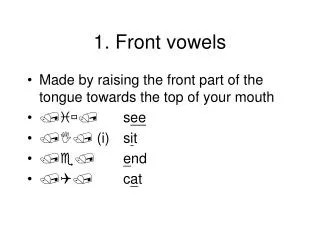
E N D
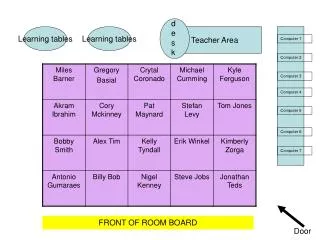
1st Skinny Front of Room Middle Aisle Empty EmptyEmpty Empty Empty Empty Coach L’s Desk
2nd Skinny Front of Room Middle Aisle Empty Empty Empty EmptyEmpty Coach L’s Desk
3rd Front of Room Middle Aisle Coach L’s Desk
Videos • Back to the Future • Michael Myers
I explain to my students using the SRPC = mirror SRAS metaphor. And I teach inflationary expectations with a basic anecdote about salaries. I ask students to envision the kind of life they could live with a $50,000 salary. What kind of house could they buy? What kind of car would they drive? Where would they shop? And (quite importantly, but oddly) what kinds of gifts could they afford to buy at Christmas? [apologies for political incorrectness, but I teach at a Catholic school - so safe bet to not offend] Now, imagine that inflation went wild over the course of that year you were making $50,000. In reality, you hardly notice it as it's happening. But inflation was an astonishing 10% instead of 2%. It's hard to move or switch cars, those prices are relatively fixed. But food prices and others might hurt over the course of the year. And what would happen to how much money you have left for Christmas presents come December? • So, what's the point? Well, when you realize it's getting expensive to live - and you can't even afford the Christmas you thought you'd have. What do you do? You ask for a raise from your boss when your contract is winding down, explaining that it's just not possible in these conditions to live the way you need to live. And if inflation has been pretty constant across industries, you perhaps get that raise. But SRAS is going to shift inward as input costs rise (you making more money) and SRPC is shifting up, as everyone is starting to accept that this 10% inflation is just a new normal.
Chapter 24 – Measuring the Cost of Living • Cost of Living – cost of maintaining a certain standard of living • The amount of money needed to sustain a certain level of living, including basic expenses such as housing, food, taxes, and healthcare.
Cost of living calculator • http://cgi.money.cnn.com/tools/costofliving/costofliving.html
Groo the Wanderer Issue #1 March 1985 – $.75 The Amazing Spiderman #700December 2012 – $7.99
Chapter 24 – Measuring the Cost of Living • Inflation – a general and sustained increase in prices, causes money to hold less value • Inflation rate – percentage change in the price level from the previous period or base year. • Normal, “healthy” rate is about 2-3% • From 1914 until 2010, the average inflation rate in United States was 3.38 percent
Dollar Value Calculator • http://www.usinflationcalculator.com/
Chapter 24 – Measuring the Cost of Living • Hyperinflation – rapid increase in prices, inflation that is out of control • Disinflation - is a decrease in the rate of inflation • A slowdown in the rate of increase of the general price level of goods and services in a nation's gross domestic product over time. • Deflation – sustained drop in the price levels • Stagflation – a combined rise in prices with a slowdown in the economy
Causes of Inflation • Quantity Theory – too much money in the economy causes inflation • Ideally, the money supply should increase at the same rate of growth in GDP
Causes of Inflation • Demand-Pull Theory – inflation occurs when demand for goods and services exceeds existing supplies
Causes of Inflation • Cost – Push Theory – inflation occurs when producers raise prices in order to meet increasing costs of inputs
Videos DucktalesZimbabweDeflation (bad for economy) http://www.youtube.com/watch?v=t_LWQQrpSc4&list=PL16DF87D4D82CCBC4&index=7&feature=plpp_video http://www.youtube.com/watch?v=vQCCDttLhA4&playnext=1&list=PL5C945AB38F1A4497&feature=results_video http://www.cnn.com/video/?/video/business/2009/07/29/boulden.deflation.jargon.buster.cnn Why not print? http://www.youtube.com/watch?v=ZkyBnaYCUhw&list=FLYtay8jXCpSl6ImxtKXk4iQ&index=1
Consumer Price Index • Consumer Price Index – an index used to measure inflation; measures the overall cost of goods and services bought by the typical urban consumer • Computed each month by the Bureau of Labor Statistics (BLS), part of the Department of Labor URBAN RURAL
What’s In Your Market Basket? • ________________________________ • ________________________________ • ________________________________ • ________________________________ • ________________________________ • ________________________________ • ________________________________ • ________________________________ • ________________________________ • ________________________________
Consumer Price Index • Market Basket – metaphorical object to represent the collection of goods and services purchased by the typical urban consumer on a monthly basis • Fix the basket of goods and services to compare prices • Derived of more than 200 sub-categories, arranged into eight major groups
Consumer Price Index • Market Basket for Products 2012 – $4114.32 FOOD AND BEVERAGES (breakfast cereal, milk, coffee, chicken, wine, full service meals, snacks) HOUSING (rent of primary residence, owners' equivalent rent, fuel oil, bedroom furniture) APPAREL (men's shirts and sweaters, women's dresses, jewelry) TRANSPORTATION (new vehicles, airline fares, gasoline, motor vehicle insurance) MEDICAL CARE (prescription drugs and medical supplies, physicians' services, eyeglasses and eye care, hospital services) RECREATION (televisions, toys, pets and pet products, sports equipment, admissions); EDUCATION AND COMMUNICATION (college tuition, postage, telephone services, computer software and accessories); OTHER GOODS AND SERVICES (tobacco and smoking products, haircuts and other personal services, funeral expenses).
Market Basket Over The Years 2013 1950’s $1.19 .15
Market Basket Over The Years 2013 1950’s $65,000 $3000
Market Basket Over The Years 2013 1950’s $13.00 .50
The typical basket of goods and services This figure shows how the typical urban consumer divides spending among various categories of goods and services. The Bureau of Labor Statistics calls each percentage the “relative importance” of the category.
What is Inflation? CPI Video http://www.youtube.com/watch?v=Vi3Q1ypNw3M&list=PL4D085215905ABBE5&index=15&feature=plpp_video http://www.youtube.com/watch?v=Si37yjZM-SA&list=PL4D085215905ABBE5&index=21&feature=plpp_video
Determining Consumer Price Index • CPI = Price of basket of goods and services in current year X 100 Price of basket in base year period • Base Period is between 1982 – 1984 • 1982/1984 – $1792.00 • Market Basket for Products • 2012 – $4114.32 • $4114.32 /1792 = 2.2959 • 2.2959X100 =229.59 • 2012 CPI = 229.59 • Prices have inflated by 129.59% since 1982-1984 (base period to 2012)
Determining inflation Rate • Inflation rate = CPI Current Year – CPI Previous Year X 100 CPI Previous Year • 2012 CPI – 229.59 • 2007 CPI – 207.34 • 229.59– 207.34 = 22.25 • 22.25/207.34= .1073 • .1073X 100 = 10.73% • Prices have inflated by 10.73% from 2007 to 2012
Determining CPI 3858.18/1792 = 2.153 x 100 = 215.30
Problems with the Consumer Price Index (overstated prices) • Substitution bias - a bias in economics index numbers arising from tendency to purchase inexpensive substitutes for expensive items when prices change. • Overstates inflation. • Consumers will consume more of the now comparatively inexpensive good and less of the now relatively more expensive good. • For example, a selected good is bought by consumers and it is therefore included in the CPI basket, but when an increase in price of that selected good occurs customers may buy a cheaper substitute, while the CPI basket does not change.
Problems with the Consumer Price Index • Introduction of new goods - CPI uses only a fixed basket of goods, the introduction of a new product cannot be reflected (done every 10 years) • iPods vs. Walkman, digital media vs. CDs • Unmeasured quality change - improvements and depreciating goods are not immediately recognized by the BLS • Fuel efficient cars
Purchasing Power and Inflation • If you receive a 10% increase in pay from last year, but prices have increased by 15%, what is the result? • You are 5% worse off. • Nominal wage increase of 10% • Real wage decrease of 5% • Your salary has to keep up with inflation or you are losing purchasing power
Purchasing Power and Inflation • Purchasing power – the number of goods/services that can be purchased with a unit of currency. • Fixed Income – income that does not increase when prices go up • Indexed – when a dollar amount is automatically corrected for inflation • Cost of living allowance/adjustment (COLA) - benefit increases based on increases in the cost of living, as measured by the Consumer Price Index. • Pension plans, Social Security, Salaries (see website)
Anticipated vs. Unanticipated Inflation • Anticipated Inflation – Expected inflation • Allows people/businesses to make accurate predictions of inflation and take steps to protect themselves from its effects. • Unanticipated Inflation – Unexpected inflation • When inflation is volatile from year to year it becomes difficult for individuals and businesses to correctly predict the rate of inflation in the near future. • Unanticipated inflation occurs when economic agents (i.e. people, businesses and governments) make errors in their inflation forecasts.
Correcting economic variables for effects of inflation • Interest rates are the gains you make from lending, or the cost you incur from borrowing. • Nominal Interest Rate – the interest as usually reported without a correction for the effects of inflation • Real Interest Rate – the interest rate corrected for the effects of inflation • Real Interest Rate = Nominal Interest Rate – Inflation
Interest Rates and Inflation • If you put $1000 into a savings account at 3% simple interest, you will have $30 at the end of the first year. • If inflation is 2%, how much have you gained in interest? • You have experienced “real” gains of 1%. • Nominally you gained $30, but you really only earned $10 • Your money in the bank has to keep up with inflation or you are losing purchasing power.
Who loses from unanticipated inflation? • Savers • Example 1: • An individual puts $100 in a fixed interest savings account. • The individual could buys the basket of goods and services today and it would cost $100. • if we anticipate inflation to be 3%, the same basket of goods and services would cost $103 in a year. • At 3% interest for 1 year, they have earned they will have earned $3, bringing the value to $103 and thus keeping up with inflation. • If prices is unexpectedly and the inflation rate is 4%, then the unanticipated inflation rate is 1%, and the saver loses purchasing power.
Who loses from unanticipated inflation? • People living on Fixed Incomes • Example: • A teacher survives on a fixed income from a prearranged contract. • If we anticipate inflation to be 3%, then the teacher needs to earn at least 3% each year to compensate for increase in cost-of-living. • If prices rise unexpectedly and the inflation rate is 6%, then the unanticipated inflation rate is 3%, and the teacher loses purchasing power, bringing down real wages.