Download
1 / 27
270 likes | 385 Views
Freight Performance Measurement. Presented to Texas Border Partnership Group 14 June 2006. Global Connectivity. Desired Outcome: Sustain the economic efficiency of goods movement on the surface transportation system. Measure(s): Travel time in significant freight corridors (baseline to be

E N D
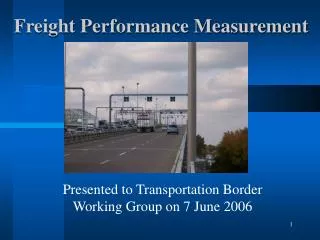
Freight Performance Measurement Presented to Texas Border Partnership Group 14 June 2006
Global Connectivity Desired Outcome: Sustain the economic efficiency of goods movement on the surface transportation system. Measure(s): Travel time in significant freight corridors (baseline to be determined in FY 2006). Average Speed Buffer Time Index (a measure of travel time reliability) Delay time at NHS border crossings (baseline to be determined in FY 2006). (Measures TBD) Examples: Total Crossing Time Average Wait Time
Goals of the FPM Initiative • Short Term • Support Monitoring Progress in Global Connectivity • Continuous and Accurate Data • Mid Term • Develop a rich data source that can be used by stakeholders in the transportation community and by academia • Output that is flexible and useful for a variety of audiences • Long Term • Use (sound FPM) data to target investment in National Highway System based where the greatest needs exist • Better truck travel data that could increase the strength and ranking of freight projects against general transportation projects
Data Collection Method • What? • Methodology use Trucks as Probes • Automatic Vehicle Location(AVL)/Satellite Technology • GPS Coordinates (Date and Time Stamped) • Unique Carrier ID • How? • Contractual partnership with American Transportation Research Institute, a Satellite Technology Vendor and Carriers • Initial data based on voluntary participation by selected carriers subscribers • Data Cleansing techniques allowed research team to collect data from all/most of the vendor’s carrier subscribers (~250,000 vehicles)
Accomplishments • Collecting, Analyzing and Processing data for Five Freight Significant Corridors • (I5, I10, I45, I65, I70) • 1 Year of Data as of Jan 06 • Collecting data for five US/Cda land border crossing areas • 1 Year of Data as of Aug 06 • As of 1 April 2006 we expanded data collection and analysis to 20 additional corridors (a more robust data set, greater “National Picture”) • Case studies scheduled with 8 States along the corridors • Weather and Work Zone Case Studies • New contract with technology vendor to include access to data for up to 10, 000 miles of arterials • Short Term and Long Term Data Sharing Strategies developed
CY 2005 Results Interstate 5 Interstate 10 Interstate 45 Interstate 65 Interstate 70 Monthly Buffer Index for Five Corridors (CY05) 50.00 45.00 44.87 41.02 40.00 35.00 34.37 34.13 31.63 31.20 30.85 30.00 29.56 Buffer Index 25.96 25.00 24.45 23.64 20.00 17.72 15.00 10.00 5.00 0.00 JAN FEB MAR APR MAY JUN JUL AUG SEPT OCT NOV DEC Month
CY 2005 Results Interstate 5 Interstate 10 Interstate 45 Interstate 65 Interstate 70 Average Speeds Five Corridors (CY 2005) 60.00 58.00 56.00 54.00 (MPH) Speed 52.00 50.00 48.00 46.00 44.00 JAN FEB MAR APR MAY JUN JUL AUG SEPT OCT NOV DEC Month
Key Border Challenges – • Some key border crossing points are seriously congested and transit times and the associated transportation costs are high. • Physical infrastructure (transportation and other) at some border crossings require upgrading • Clearance and Inspection procedures change and vary • Localized data collection systems differ dramatically
FPM Border Component • Data Collection Began 7/01/05 for 5 Crossings • Blaine (Pacific Highway): Blaine, WA • Pembina: Pembina, ND • Ambassador Bridge: Detroit, MI • Peace Bridge: Buffalo, NY • Effort looks at crossings as wellas transportation network that supports the crossings
Pacific Highway/Blaine • U.S. Roadways • PRIMARY HIGHWAY • Washington State Highway • 543 • Interstate 5 • Canadian Roadways • PRIMARY HIGHWAYS1) Blaine Border Area (Route • ID ‘BC’): 2) British Columbia Provincial • 993) BC Provincial 15
AMBASSADOR • U.S. Roadways • PRIMARY HIGHWAYS • Michigan Route 3 • Interstate 75 • Interstate 94 • Interstate 96 • The Ambassador Bridge (AB): • Canadian Roadways • PRIMARY HIGHWAYS • ON Provincial 401 • ON Provincial • E.C. Row EXPY • FEEDER ROADS • 4) ON Provincial 403
PEMBINA • U.S. Roadways • PRIMARY HIGHWAY • Interstate 29 • Canadian Roadways • PRIMARY HIGHWAY • Manitoba Provincial 75 • FEEDER ROADS • Trans Canada 100 (Winnipeg) • Trans Canada 1 • Trans Canada 17 (Ontario)
PEACE BRIDGE • U.S. Roadways • PRIMARY HIGHWAYS • Peace Bridge Connector (US) • Interstate 190 • FEEDER ROADS • 1) Interstate 90 • 2) Interstate 79 • Canadian Roadways • PRIMARY HIGHWAY • Queen Elizabeth Way • FEEDER ROADS • 4) ON Provincial 403 • 5) ON Provincial 407
CHAMPLAIN • U.S. Roadways • PRIMARY HIGHWAY • Interstate 87 (I-87 • Canadian Roadways • PRIMARY HIGHWAY • Provincial 15 • Provincial 30 • Provincial 20
What Willbe the Measures? • Average delay per Truck Trip (in Minutes or Hours) • Average Travel Time • Total Delay • Average annual cost of delay • Buffer Time • Buffer Index
Frequently Asked Questions • Q: What is the primary focus of the initiativeA: Historical data for monitoring performance. Not probable this will evolve to a “real-time” product • Q: What is the sample size A: Technology vendor, has approximately 250,000 in USA, Canadian subsidiary adds additional vehicles • Q: How did you select the five crossings? A: Five Border Crossings account for over 55% of inbound CV to US. Q: Who Owns the data? A: The carriers who subscribe to the vendor’s service • Q: Can we share the data A: Aggregated/summarized data can be shared with little limitations, currently able to share raw data with public transportation agencies (primarily for assessment of utility) • Q: What are the next steps
Key Next Steps • Analyzing the US/Cda border data and developing appropriate measures of delay and wait time • Initiate effort to collect US/MX border data • Small Grants in 2005 and 2006 for exploratory research • US/MX Crossings / Corridors likely to be aligned with corridor work done by US/MX JWC • Assessing utility beyond FHWA PM needs • Case Studies under way • State Case Studies ((includes Washington) • Weather Case Study • Work Zone Case Study • Transitioning data to a performance measurement framework • Targets • Strategies and tactics to produce positive change
Future Research • Arterial Data Collection and Analysis • Incidents (Network Effects) • Congestion Pricing at the Border • Linked Journeys • Directional Data Analysis • Data to support Planning • Demand Modeling • Forecasting Models • Economic Analysis • Project Analysis (Before, After, During)
More Information Crystal Jones FHWA, Office of Freight Management and Operations 202-366-2976 Crystal.Jones@dot.gov http://ops.fhwa.dot.gov/freight/documents/travel_time_flyer.pdf
Safe, Accountable, Flexible, Efficient Transportation Equity Act: A Legacy for Users (SAFETEA-LU) Section 1302,National Corridor Infrastructure Improvement Program Secretary to establish a program for receiving grant applications and establish criteria for selection. For States only. For projects in corridors of national significance to promote economic growth and international or interregional trade. connect existing highway system segments, facilitate regional mobility, serve increasing freight volume, serve international freight volume, reduce congestion and travel time, serve high-value cargo, and use innovative financing $1.948 billion over 5 years (2005-2009) for 33 designated projects
National Corridor Infrastructure Improvement Program Under SAFTEA-LU (TX) • Texas, Arkansas, Mississippi, Tennessee, Kentucky, Indiana, [Louisiana] • Total Projects: 1 • Total Funding*: $50M • Project List: Planning, Design and Construction of I-69 (TX, LA, AR, MS, TN, KY, IN) • Annual Funding Levels • 2005: $5.0M • 2006: $10.0M • 2007: $12.5M • 2008: $12.5M • 2009: $10.0M *The funding levels in this column equal the totals authorized in SAFETEA-LU section 1302, however, the funding is subject to obligation limitation set in annual Appropriations Acts.
National Corridor Infrastructure Improvement Program Under SAFTEA-LU (Neighboring States) • Louisiana • Total Projects: 5 • Total Funding*: $230M • Project List: Improvements to LA Highway 1 between Caminada Bridge and the LA1-US90 interchange [20]; Construction of 36 mi. segment of I-49 between AR state line and I-220 in Shreveport [150]; LA1 Replacement [5]; Construction of I-49 North from I-220 in Shreveport to AR state line [27.5]; Transportation improvements to I-49 South [27.5] • Oklahoma • Total Projects: 2 • Total Funding*: $145M • Project List: Ports-to-Plains Corridor [35]; OK I-44 from Riverside to Yale Ave. in Tulsa [110]
For More Information FHWA Staff Contacts Ed Strocko202-366-2997ed.strocko@dot.gov Rolf Schmitt202-366-9258rolf.schmitt@fhwa.dot.gov http://www.ops.fhwa.dot.gov/freight/safetea_lu/1302_nciip_funding.htm http://www.ops.fhwa.dot.gov/freight/policy.htm