Download
1 / 10
100 likes | 267 Views
§9.2 Quadratic Functions. Evaluate the expression for the following values of a and b . a = –6, b = 4 2. a = 15, b = 20 Graph each function. 5 . y = x 2 6. y = – x 2 + 2 . – b 2 a. Warm-Up. 1 3. for a = –6, b = 4. for a = 15, b = 20. =. =. –4 –12. –20

E N D
Evaluate the expression for the following values of a and b. a= –6, b = 4 2.a= 15, b = 20 Graph each function. 5.y = x26. y= –x2 + 2 –b 2a Warm-Up
1 3 for a = –6, b = 4 for a = 15, b = 20 = = –4 –12 –20 30 –4 2(–6) –20 2(15) 5. y = x2 6. y = –x2 + 2 b 2a b 2a – 1. – 2 3 – = = 2. Solutions
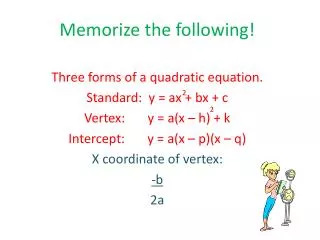
Property Graph of a Quadratic Function The graph of y = ax2 + bx + c, where a ≠ 0, has the line x = -b/2a as its axis of symmetry. The x-coord. of the vertex is –b/2a.
Step 1: Find the equation of the axis of symmetry and the coordinates of the vertex. Find the equation of the axis of symmetry. x = = = – 1 The x-coordinate of the vertex is –1. b 2a y = 2x2 + 4x – 3 y = 2(–1)2 + 4(–1) – 3 = –5 – To find the y-coordinate of the vertex, substitute –1 for x. –4 2(2) The vertex is (–1, –5). Example 1: Graphing y = ax2 + bx + c Graph the function y = 2x2 + 4x – 3.
Choose a value for x on the same side of the vertex. Let x = 1 y = 2(1)2 + 4(1) – 3 = 3 For x = 1, y = 3, so another point is (1, 3). Find the y-coordinate for x = 1. Example 1: Graphing y = ax2 + bx + c (continued) Step 2: Find two other points. Use the y-intercept. For x = 0, y = –3, so one point is (0, –3).
Then draw the parabola. Example 1: Graphing y = ax2 + bx + c (continued) Step 3:Reflect (0, –3) and (1, 3) across the axis of symmetry to get two more points.
Example 2: Using the Vertical Motion Model Aerial fireworks carry “stars,” which are made of a sparkler-like material, upward, ignite them, and project them into the air in fireworks displays. Suppose a particular star is projected from an aerial firework at a starting height of 610 ft with an initial upward velocity of 88 ft/s. How long will it take for the star to reach its maximum height? How far above the ground will it be? The equation h = –16t2 + 88t + 610 gives the height of the star h in feet at time t in seconds. Since the coefficient of t2 is negative, the curve opens downward, and the vertex is the maximum point.
– b 2a Step 1: Find the x-coordinate of the vertex. After 2.75 seconds, the star will be at its greatest height. –88 2(–16) = = 2.75 Example 2: Using the Vertical Motion Model (continued) Step 2: Find the h-coordinate of the vertex. h = –16(2.75)2 + 88(2.75) + 610 Substitute 2.75 for t. h = 731 Simplify using a calculator. The maximum height of the star will be about 731 ft.
Assignment: Pg. 556-558 8, 9, 11, 12, 14, 15, 17-19, 21, 22, 24, 25, 28-35