Download
1 / 30
300 likes | 409 Views
Screen. Cabinet. Cabinet. Lecturer’s desk. Table. Computer Storage Cabinet. Row A. 3. 4. 5. 19. 6. 18. 7. 17. 16. 8. 15. 9. 10. 11. 14. 13. 12. Row B. 1. 2. 3. 4. 23. 5. 6. 22. 21. 7. 20. 8. 9. 10. 19. 11. 18. 16. 15. 13. 12. 17. 14. Row C. 1. 2.

E N D
Screen Cabinet Cabinet Lecturer’s desk Table Computer Storage Cabinet Row A 3 4 5 19 6 18 7 17 16 8 15 9 10 11 14 13 12 Row B 1 2 3 4 23 5 6 22 21 7 20 8 9 10 19 11 18 16 15 13 12 17 14 Row C 1 2 3 24 4 23 5 6 22 21 7 20 8 9 10 19 11 18 16 15 13 12 17 14 Row D 1 2 25 3 24 4 23 5 6 22 21 7 20 8 9 10 19 11 18 16 15 13 12 17 14 Row E 1 26 2 25 3 24 4 23 5 6 22 21 7 20 8 9 10 19 11 18 16 15 13 12 17 14 Row F 27 1 26 2 25 3 24 4 23 5 6 22 21 7 20 8 9 10 19 11 18 16 15 13 12 17 14 28 Row G 27 1 26 2 25 3 24 4 23 5 6 22 21 7 20 8 9 29 10 19 11 18 16 15 13 12 17 14 28 Row H 27 1 26 2 25 3 24 4 23 5 6 22 21 7 20 8 9 10 19 11 18 16 15 13 12 17 14 Row I 1 26 2 25 3 24 4 23 5 6 22 21 7 20 8 9 10 19 11 18 16 15 13 12 17 14 1 Row J 26 2 25 3 24 4 23 5 6 22 21 7 20 8 9 10 19 11 18 16 15 13 12 17 14 28 27 1 Row K 26 2 25 3 24 4 23 5 6 22 21 7 20 8 9 10 19 11 18 16 15 13 12 17 14 Row L 20 1 19 2 18 3 17 4 16 5 15 6 7 14 13 INTEGRATED LEARNING CENTER ILC 120 9 8 10 12 11 broken desk
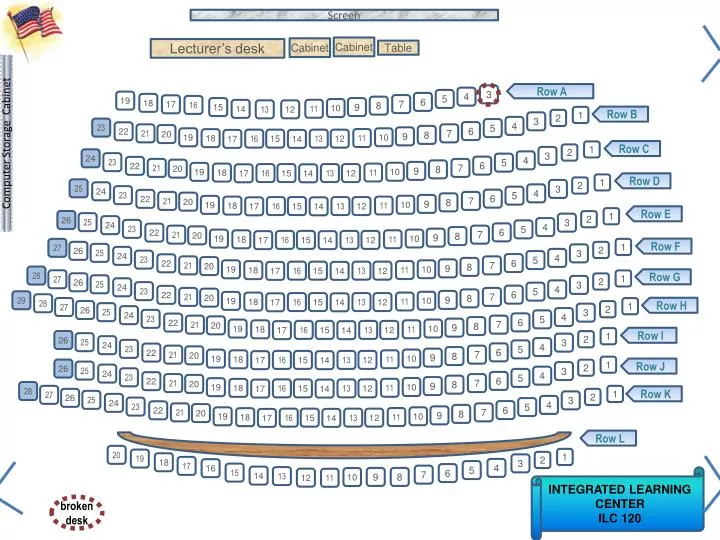
Introduction to Statistics for the Social SciencesSBS200, COMM200, GEOG200, PA200, POL200, or SOC200Lecture Section 001, Fall, 2013Room 120 Integrated Learning Center (ILC)10:00 - 10:50 Mondays, Wednesdays & Fridays. Welcome http://www.youtube.com/watch?v=oSQJP40PcGI
Homework due – Wednesday (October 16th) On class website: Please print and complete homework worksheet #13 Approaches to probability and using normal curve to find probability Please click in My last name starts with a letter somewhere between A. A – D B. E – L C. M – R D. S – Z
Use this as your study guide By the end of lecture today10/11/13 Connecting probability, proportion and area of curve Percentiles Probability of an eventComplement of the probability of an event Mutually exclusive characteristics Collectively Exhaustive Events Union and Intersection of two events Special Law of Addition Conditional Probabilities Central Limit Theorem
Schedule of readings Before next exam (October 18th) Please read chapters 5, 6, & 8 in Ha & Ha Please read Chapters 10, 11, 12 and 14 in Plous Chapter 10: The Representativeness Heuristic Chapter 11: The Availability Heuristic Chapter 12: Probability and Risk Chapter 14: The Perception of Randomness
Lab sessions Labs continue next week
Mean = 100 Standard deviation = 5 If we go up one standard deviation z score = +1.0 and raw score = 105 If we go down one standard deviation z score = -1.0 and raw score = 95 85 90 95 100 105 110 115 If we go up two standard deviations z score = +2.0 and raw score = 110 If we go down two standard deviations z score = -2.0 and raw score = 90 85 90 95 100 105 110 115 If we go up three standard deviations z score = +3.0 and raw score = 115 If we go down three standard deviations z score = -3.0 and raw score = 85 85 90 95 100 105 110 115 z score: A score that indicates how many standard deviations an observation is above or below the mean of the distribution z score = raw score - mean standard deviation
Raw scores, z scores & probabilities Z Scores Have z Find raw score Have z Find area z table Formula Have area Find z Area & Probability Raw Scores Have raw score Find z
. Find score associated with the 75th percentile 75th percentile Go to table nearest z = .67 .2500 x = mean + z σ = 30 + (.67)(2) = 31.34 .7500 .25 .5000 24 36 ? 28 34 26 30 31.34 z = .67
. Find the score associated with the 25th percentile 25th percentile Go to table nearest z = -.67 .2500 x = mean + z σ = 30 + (-.67)(2) = 28.66 .2500 .25 .25 28.66 24 ? 36 28 34 26 30 z = -.67
Variability and means Variability and means 38 40 44 48 52 56 58 The variability is different…. The mean is the same … What might the standard deviation be? 38 40 44 48 52 56 58 Remember to keep number lines same for both examples
Variability and means Grades of all students in the class • 65 70 75 80 85 90 • Grades Grades of “C” students What might the standard deviation be? What might this be an example of? • 65 70 75 80 85 90 • Grades Other examples?
Variability and means Remember, there is an implied axis measuring frequency f 60 65 70 75 80 85 90 f Remember to keep number lines equally spaced 60 65 70 75 80 85 90 Remember to keep number lines same for both examples Variable must be numeric
Variability and means Birth weight for infants From entire population 1 3 5 7 9 11 13 Birth weight in pounds Birth weight for infants from a “typical family” What might the standard deviation be? What might this be an example of? • 3 5 7 9 11 13 • Birth weight in pounds Other examples? Notice: number lines equally spaced
Variability and means Social distance norm(personal space) for international community 40 50 60 70 80 90 100Social Distance Norm Social distance norm (personal space) for Tucson What might the standard deviation be? What might this be an example of? 40 50 60 70 80 90 100 Social Distance Norm Other examples? Notice: number lines equally spaced
Variability and means Distributions same mean different variability Final exam scores “C” students versus whole class Birth weight within a typical family versus within the whole community Running speed 30 year olds vs. 20 – 40 year olds Number of violent crimes Milwaukee vs. whole Midwest Social distance (personal space) California vs international community
Variability and means Distributions different mean same variability Performance on a final exam Before versus after taking the class 40 50 60 70 80 90 100 Score on final (before taking class) 40 50 60 70 80 90 100 Score on final (before taking class) Notice: number lines equally spaced
Variability and means Distributions different mean same variability Height of men versus women 62 64 66 68 70 72 74 76Inches in height (women) 62 64 66 68 70 72 74 76Inches in height (men) Notice: number lines equally spaced
Variability and means Distributions different mean same variability Driving ability Talking on a cell phone or not 2 4 6 8 10 12 14 16Number of errors (not on phone) 2 4 6 8 10 12 14 16Number of errors (on phone) Notice: number lines equally spaced
Variability and means Comparing distributions different mean same variability Performance on a final exam Before versus after taking the class Height of men versus women Driving ability Talking on a cell phone or not Notice: number lines equally spaced
. Writing AssignmentComparing distributions (mean and variability) • Think of examples for these three situations • same mean but different variability • same variability but different means • same mean and same variability (different groups) • estimate standard deviation • calculate variance • for each curve find the raw score for the z’s given Remember: number lines equally spaced
. Writing AssignmentComparing distributions (mean and variability) • Think of examples for these three situations • same mean but different variability • same variability but different means • same mean and same variability (different groups) • estimate standard deviation • calculate variance • for each curve find the raw score for the z’s given Hand in worksheet
What is probability 1. Empirical probability: relative frequency approach Number of observed outcomes Number of observations Probability of getting into an educational program Number of people they let in 400 66% chance of getting admitted Number of applicants 600 Probability of getting a rotten apple 5% chance of getting a rotten apple Number of rotten apples 5 Number of apples 100
What is probability 1. Empirical probability: relative frequency approach “There is a 20% chance that a new stock offered in an initial public offering (IPO) will reach or exceed its target price on the first day.” “More than 30% of the results from major search engines for the keyword phrase “ring tone” are fake pages created by spammers.” 10% of people who buy a house with no pool build one. What is the likelihood that Bob will? Number of observed outcomes Number of observations Probability of hitting the corvette Number of carts that hit corvette Number of carts rolled 182 = .91 200 91% chance of hitting a corvette
2. Classic probability: a priori probabilities based on logic rather than on data or experience. All options are equally likely (deductive rather than inductive). Likelihood get question right on multiple choice test Chosen at random to be team captain Lottery Number of outcomes of specific event Number of all possible events In throwing a die what is the probability of getting a “2” Number of sides with a 2 1 16% chance of getting a two = Number of sides 6 In tossing a coin what is probability of getting a tail 1 Number of sides with a 1 50% chance of getting a tail = 2 Number of sides
3. Subjective probability: based on someone’s personal judgment (often an expert), and often used when empirical and classic approaches are not available. 60% chance that Patriots will play at Super Bowl Likelihood that company will invent new type of battery Likelihood get a ”B” in the class There is a 5% chance that Verizon will merge with Sprint Bob says he is 90% sure he could swim across the river
Approach Example Empirical There is a 2 percent chance of twins in a randomly-chosen birth Classical There is a 50 % probability of heads on a coin flip. Subjective There is a 5% chance that Verizon will merge with Sprint
Thank you! See you next time!!