Download
1 / 104
1.08k likes | 2.08k Views
100 market based business models, diagrams and charts for powerful business presentations. Content: Custoner Value, Shareholder Value, Market-based-Strategies, Market Potential, Value Creation, Economic Benefits, Market Segmentation, Targeting, Competitive Advantage, Industry Analysis, Prisoners Dilemma, Switch Cost, Pricing, Skimming, Penetration, Channel Management, Push-Pull, Portfolio Analysis, Life Cycle Analysis, Market Performance, Sales Forecast, Four P's, Competitor Analysis, Transaction Marketing, Consumer Behavior, Mass Customization, Cluster Theory, Value Chain, Marketing Information, Brand Management, AIDA, Marketing Plan, SWOT, New Age Pricing, Pruducer/Custormer Gap, Mass Production/nMore business diagrams to download on http://www.drawpack.com your visual business knowledge

E N D
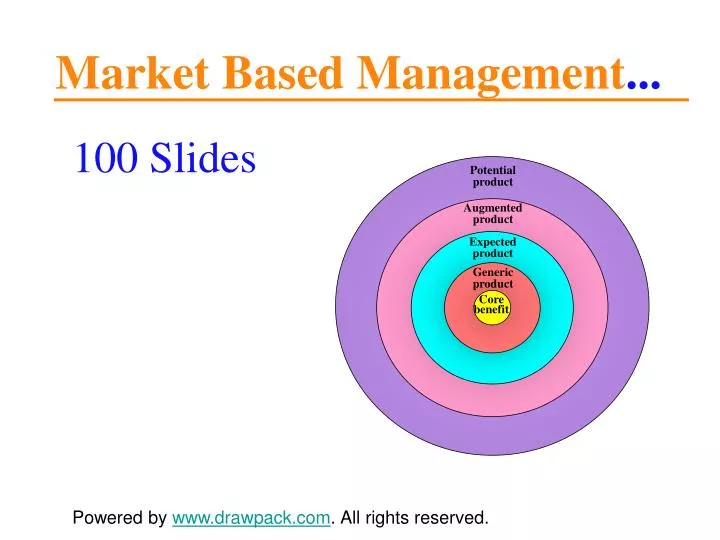
Potential product Augmented product Expected product Generic product Core benefit Market Based Management... 100 Slides Powered by www.drawpack.com. All rights reserved.
Key Words... Customer Value – Shareholder Value – Market-based-Strategies – Market Potential – Value Creation – Economic Benefits – Market Segmentation – Targeting – Competitive Advantage – Industry Analysis – Prisoners Dilemma – Switch Cost – Pricing – Skimming – Penetration – Channel Management – Push-Pull – Portfolio Analysis – Life Cycle Analysis – Market Performance – Sales Forecast – Four P’s – Competitor Analysis – Transaction Marketing – Consumer Behavior – Mass Customization – Cluster Theory – Value Chain – Marketing Information – Brand Management – AIDA – Marketing Plan – SWOT – New Age Pricing – Producer/Customer Gap – Mass Production
Poor Understanding of Customers and Competition Pressure for Short-Run Results Unfocused Competitive Position Stagnant Shareholder Value Me-Too Customer Value Accounting Maneuvers Drive Financial Results Excessive Customer Turnover Sporadic Business Unit Profit Market Share Instability High Cost of Customer Retention and Acquisition How to Underwhelm Customers and Shareholders
100 Business Profitability 90 Customer Retention 80 Market Orientation Score (0-100) Market Orientation 70 60 Marketing Knowledge 50 Bottom Middle High Marketing Knowledge Marketing Knowledge and Market Orientation
Strategies to Grow Market Demand Strategies to Increase Market Share Strategies to Grow Customer Purchases Net Marketing Contribution Market Demand Market Share Revenue per Customer Variable Cost per Customer Marketing Expenses = - - X X Strategies to Lower Variable Cost per Customer Strategies to Enter or Exit Markets Strategies to Increase Marketing Efficiency Fundamental Market-Based Strategiesand Profitable Growth
Sales-Based Structure Market-Based Structure Earthmoving Equipment Division Earthmoving Equipment Division Sales Organization Mining Marketing Unit Construction Marketing Unit Dealer Sales Mining Dealers Mining Dealers Direct Sales Construction Dealers End-User Market Mining and Construction End-User Market Mining End-User Market Construction Sales-Based vs. Market-BasedOrganizational Structure
Maximum Number of Potential Customers Not Affordable Lack Benefits Untapped Market Opportunity Unable to Use Not Available Not Aware Current Market Demand Developed Market Maximum Market Potential andCurrent Market Demand
100% Full Market Development 80% 60% Market Development Gap 40% 20% Mainstream Market Early Market 0% Innovators Early Adopters Early Majority Late Majority Laggards Customer Adoption and Market Development
Price Paid Amazon.com lowers purchase price with the on-line purchase of books. Acquisition Costs American Hospital Supply reduces a hospital’s cost with a computerized customer order program. Usage Costs Sealed Air reduces labor cost in packaging with AirCap. Total Cost of Purchase Maintenance Costs Saturn lowers the cost of repair and insurance through module product design. Ownership Costs GE Capital works with customers to create affordable ownership. Disposal Costs Rohm-Haas’s Kathon MWX cuts cost of disposal of machine fluid waste in half. Economic Benefits and Value Creation
Consumer Market Customer Needs Demographic Forces Lifestyle Forces Usage Behaviors - Age - Income - Marital Status - Education - Occupation - Attitudes - Values - Activities - Interests - Political View - Quantity - Time of Use - Personal - Social - Frequency of Use Fundamental Forces That Shape Differencesin Customer Needs
Business-to-Business Customer Needs Firmographic Forces Business Culture Usage Behaviors - Number of Employees - Sales Volume - Number of Locations - Years in Business - Financial Situation - Business Sophistication - Growth Orientation - Innovativeness - Technology - Decision Making - Application - Quantity - Time of Purchase - Frequency of Purchase - Users Fundamental Forces That Drive Differencesin Business-to-Business Customer Needs
Growth-Oriented Entrepreneurs Core Business Need Ways to invest and grow Firmographics Medium size More sophisticated Higher in education Ongoing financial plan Purchase Behavior Products that enhance productivity High revenue per customer Willing to buy value-added solutions Value Proposition Solutions that help you grow your business Cost-Focused Sustainers Core Business Need Ways to continue and save Firmographics Small in sales / employees Less sophisticated Lower in education Limited or no financial plan Purchase Behavior Products that lower cost Low revenue per customer Confused by value-added solutions Value Proposition Solutions that saves your business money Growth-Oriented Cost-Focused Market Segmentationof the Small Business Market
Segment Attractiveness Market Growth Competitive Intensity Market Access - Market Size - Growth Rate - Market Potential - Number Of Companies - Ease of Entry - Substitutes - Customer Familiarity - Channel Access - Company Fit Forces That Shape Segment Attractiveness
Mass Market Approach Large Segment Strategy Adjacent Segment Strategy Multi-segment Strategy Small Segment Strategy Niche Segment Strategy Mass Customization Strategy Segment A Segment A1 Segment A Segment A Segment A2 Segment A3 Segment A4 Segment A5 Segment B Segment B Segment B1 Segment B2 Segment B3 Segment C Segment C Segment C1 Segment C2 Segment C2 Segmentation Hierarchy: Mass Market toMass Customization Strategies
Competitive Position and Profitability Industry Forces Competitor Benchmarking Competitive Advantage - Competitor Intelligence - Competitor Analysis - Competitive Benchmarking - Market Entry/Exit - Buyer/Supplier Power - Substitutes/Rivalry - Cost Advantage - Quality Advantage - Marketing Advantage Competitive Forces That Shape Competitive Position and Profitability
Competitive Environment Industry Forces Barriers to Entry Barriers to Exit Buyer Power Supplier Power Substitutes Competitive Rivalry Unfavorable Low High High High Many Intense Favorable High Low Low Low None None The more favorable the forces that shape a market’s competitive environment, the greater a business’s profit potential Profit Potential More favorable competitive environment Less favorable competitive environment Unfavorable Favorable Competitive Environment Industry Analysis: Industry Forces andProfit Potential
Competitor’s Marketing Strategy Business’s Marketing Strategy Hold Price Cut Price 5% Market Share = 10% Volume = 1 million units Price = $100 per unit Margin = $40 per unit Total Cont. = $40 million Market Share = 8% Volume = 800’000 units Price = $100 per unit Margin = $40 per unit Total Cont. = $32 million Hold Price Market Share = 10% Volume = 1 million units Price = $95 per unit Margin = $35 per unit Total Cont. = $35 million Market Share = 12% Volume = 1.2 million units Price = $95 per unit Margin = $35 per unit Total Cont. = $42 million Cut Price 5% Performance Impact of Price Rivalry and Prisoner‘s Dilemma
Competitive Advantage Cost Advantage Differentiation Advantage Marketing Advantage - Variable Costs - Marketing Expenses - Operating Expenses - Product Differentiation - Service Quality - Brand Reputation - Distribution - Sales Effort - Brand Awareness Major Sources of Competitive Advantage
Scale Effect Scope Effect Cost per Unit Cost per Unit C1 Auto-mobiles Motor-cycles Lawn-mowers Snow Blowers Pumps C2 Production Capacity Product Breadth Ignition Switch Cost Advantage Due to Scale and Scope Effects
Product Differentiation Price Product Breadth Sales Force Physical Distribution Retailing & Merchandising Market Share Product Position Marketing Effort = X Customer Support Service Quality Media Advertising Sales Promotion New Products Brand Image Product-Price Position, Marketing Effort,and Market Share
Product Management Strategies Product Positioning and Differentiation Product Line Positioning and Extension Strategies New Product Development - Low Price/Cost of Purchase - Product Differentiation - Service/Brand - Product Line Positioning - Product Line Extensions - Product Bundling - New Product Sales - New Product Innovation - Development Process Core Elements ofProduct Management Strategy
Service Differentiation Brand Differentiation Product Differentiation Product Benefits Product Benefits Product Benefits Customer Value Customer Value Customer Value Price Price Price Service Benefits Service Benefits Service Benefits Nonprice Costs Nonprice Costs Nonprice Costs Brand Benefits Brand Benefits Brand Benefits Total Benefits Total Cost Total Benefits Total Cost Total Benefits Total Cost Differentiation and Customer Value I
Product Benefits Customer Value Product Differentiation Price Service Benefits Service Differentiation Transaction Costs Brand Differentiation Brand Benefits Low-Price Position Total Benefits Derived from Product Position Total Cost of Obtaining These Benefits Lower Transaction Costs Differentiation and Customer Value II
Customers • Need / Benefits • Price Sensitivity • Demand / Growth • Market-Based Pricing • Economic Value Pricing • Perceived Value Pricing • Segment Pricing • Impacts • Customer Value • Market Share • Profitability • Competitors • Number / Entry • Positioning • Objectives Market Situation • Positioning • Market Share • Differentiation • Cost / Supply • Cost-Based Pricing • Commodity Pricing • Cost Leader Pricing • Competitive Bid Pricing Pricing Differentiation and Customer Value
Perceived Value vs. Costs Total Cost of Ownership Product Benefits Price Perceived Value Economic Value Price Price Maintenance Service Benefits Cost Perception Use Maintenance Use Nonprice Costs Brand Benefits Acquisition Acquisition Competitor’s Product Business’s Product Relative Benefits Relative Cost Market-Based Value Pricing
Raise Price Unit Volume Decrease Sales Revenue Increase Unit Margin Increase Unit Contribution Increase Inelastic (<-1) Lower Price Decrease Decrease Decrease Increase Hold Price Unity (=-1) Price Elasticity No change Maximum No change No change Raise Price Decrease Decrease Increase Inc/Dec* Elastic (>-1) Decrease Lower Price Increase Increase Inc/Dec* * The total contribution could increase or decrease, depending on the level of elasticity and unit margin. Price Elasticity and Performance
Skim Pricing Price Favorable Conditions Considerable Differentiation Quality-Sensitive Customers Sustainable Advantage Few Competitors Few Substitutes Difficult Competitor Entry Dollars per Unit Cost Time Skim Pricing
Penetration Pricing Favorable Conditions No/Limited Differentiation Price-Sensitive Customers No Sustainable Advantage Many Competitors Many Substitutes Easy Competitor Entry Price Dollars per Unit Cost Time Penetration Pricing
Total Revenue 35 30 Total Costs 25 $ Millions 20 15 Fixed Expenses* 10 5 0 50 100 150 200 Break-Even Volume (90,000) Units Sold (‘000) Profit Loss * Fixed Expenses = Marketing Expenses and Other Direct Expenses Break-Even Volume for a Given Price Strategy
Alternative Channel Systems Direct Channel Systems Mixed Channel System Indirect Channel Systems Channel Intermediaries Target Market Customers • Direct Channel Systems: Provide alternative direct channel and sales systems that require the business to retain ownership (title) of products sold and responsibility for delivery to customers and value-added functions desired by customers. • Indirect Channel Systems: Provide varying degrees of sales and value-added functions while taking ownership and responsibility for delivery to target customers or other intermediaries. • Mixed Channel Systems: Provide direct sales contact and technical support while the actual purchase is made at a channel intermediary who has taken title (ownership) of the products being sold. Alternative Channel Systems
Manufacturers Direct Channel Systems Indirect Channel Systems Direct Sales On-Line Marketing Direct Marketing Tele- marketing Reps/ Agents Reps/Agents Wholesalers Retailers Customer Markets Alternative Customer Channel Systems
Pulsing Heavy-Up 250 250 200 200 150 150 Gross Rating Points Gross Rating Points 100 100 50 50 0 0 1 5 9 13 17 21 25 29 1 5 9 13 17 21 25 29 Weeks Weeks 100% 100% 80% 80% 60% 60% Ad Awareness Ad Awareness 40% 40% 20% 20% 0% 0% 1 5 9 13 17 21 25 29 1 5 9 13 17 21 25 29 Weeks Weeks Message Reinforcement Strategies
Customer Response Customer Pull Customer Push • Market Coverage • Availability • Stockouts • Distributor Push • Merchandising • Marketing Effort • Customer Preference • Awareness • Attraction • Customer Loyalty • Commitment • Search Effectiveness Customer Pull Communications Customer Push Communications Communications Mix Advertising Sales Promotions Catalogs Direct Marketing Telemarketing Electronic Marketing Public Relations Push-Pull Communicationsand Customer Response
Tactical Marketing Strategy and Performance Plan Portfolio Analysis and Strategic Market Plan Business Performance Market Attractiveness Competitive Advantage • - Share Position • Sales Growth • Profitability - Market Forces - Competitive Intensity - Market Access - Differentiation - Cost - Marketing Strategic Market Planning Process
Market Attractiveness Market Forces Competitive Intensity Market Access • Market Size • Growth Rate • Buyer Power • Customer Loyalty • Number of Competitors • Price Rivalry • - Ease of Entry • - Substitutes • Customer Familiarity • Channel Access • - Sales Requirements • - Company Fit Factors That Shape Market Attractiveness
Very Attractive Offensive (Grow) Defensive (Protect) Offensive(Grow) Defensive(Protect) Offensive(Entry) Offensive (Grow) Defensive (Protect / Harvest) Offensive (Grow) Defensive (Protect / Focus) Offensive (Grow) Defensive (Protect / Focus) Defensive(Divest or Harvest) Defensive(Divest or Harvest) Defensive(Protect or Harvest) Very Unattractive Market Attractiveness Very Weak Very Strong Competitive Advantage Protect Invest to protect or hold a competitive advantage. Businesses often fail to invest in hold strategies, and the result is an erosion of competitive advantage. Grow Invest to improve or grow competitive advantage. In an underdeveloped or emerging market, this can also mean to invest in order to grow the market, and hence, its attractiveness. Focus Selectively narrow market focus to profitable segments or niches within a segment in order to capture profits while limiting the resources committed to this market. Harvest Adjust prices and marketing expenses to gradually exit the market while attempting to maximize profits during this gradual exit. Entry Invest to enter an attractive market to establish a desired competitive advantage. This strategy could also require investment to accelerate the growth of a new or underdeveloped market. Divest Quick divestment from a market. When there are no short-term profits to be gained with a harvest strategy, an immediate exit strategy is appropriate. Portfolio Analysis and Strategic Market Plans
Business Performance Share Position Sales Revenue Growth Profit Performance Offensive Strategic Market Plans Defensive Strategic Market Plans • Penetrate or Grow Existing Markets • Enter or Develop New Markets • Protect or Reduce Focus within Existing Markets • Harvest or Divest Existing Markets Offensive and Defensive Strategic Market Plans
Defensive Offensive/ Defensive Defensive Offensive/ Defensive Sales Revenue Offensive Offensive Offensive Emerging Market Early Growth Rapid Growth Late Growth Maturing Market Mature Market Declining Market Product Life Cycle andOffensive and Defensive Marketing Strategies
Offensive Strategic Market Plans Market Penetration Strategies New Market Entry Strategies • Grow Market Share • Grow Customer Purchases • Enter New Market Segment • Grow Market Demand • Related New Market Entry • Diversified New Market Entry • Enter New Emerging Market • Develop New Market Potential Offensive Strategic Market Plans
Defensive Strategic Market Plans Protect Market Position Exit Market Position • Protect Market Share • Build Customer Retention • Reduced Focus • Harvest Price Strategy • Harvest Resource Strategy • Divest Market Position Defensive Strategic Market Plans
Very Attractive Protect Protect Protect or Harvest Protect or Focus Protect or Focus Market Attractiveness Harvest or Divest Harvest or Divest Protect or Harvest Very Unattractive Very Weak Very Strong Competitive Advantage Portfolio Positions andDefensive Strategic Market Plans
Situation Analysis Market Demand Market Demand Market Demand Market Demand Market Demand • Sales • Customer satisfaction • Margins/Profit • Size and Growth • Potential • Environment • End Users • Intermediaries • Nonconsumers • Structure • Gap Analysis • Substitutes • Market Share • Price / Quality • Cost / Value Major Components of a Situation Analysis
Market Demand (Customers) Customer Volume Market Share (Percent) Total Contribution Revenue per Customer Net Marketing Contribution Margin per Customer Variable Cost per Customer Net Profits (before taxes) Marketing Expenses Operating Expenses A Customer-Based Model of Net Profits
Market Demand (Customers) Customer Volume Current Assets Market Share (Percent) Total Contribution Revenue per Customer Net Marketing Contribution Variable Cost per Customer Net Profits (before taxes) Marketing Expenses Margin per Customer Fixed Expenses Operating Expenses Accounts Receivable Return on Assets Inventory Total Assets Cash Plant and Equipment A Customer-Based Model of Return on Assets
Market Performance Operational Performance Profit Performance • Market Metrics • Market Share • Customer Satisfaction • Customer Retention • Product Awareness • Service Quality • Operational Merits • Margin (% of sales) • Overhead (% of sales) • Inventory Turnover • Accts. Rec. (days outstanding) • Capacity Utilization • Profitability Merits • Return on Assets • Return on Equity • Earnings per Share • Economic Value Added • Price-Earnings Ratio X = Market, Operational and Profit Performance
INDUSTRY ATTRACTIVENESS Manage Selectively for Earnings Invest Invest Manage Selectively for Earnings Harvest or Divest Invest BUSINESS STRENGTH Manage Selectively for Earnings Harvest or Divest Harvest or Divest GE / McKinsey Multifactor Portfolio Matrix
Sales Forecast Sales Potential Market Potential Total Population Market Potential, Sales Potential,and Sales Forecast
SELECTIVE EMPHASIS HEAVY EMPHASIS HEAVY EMPHASIS LIMITED SUPPORT SELECTIVE EMPHASIS HEAVY EMPHASIS MARKET OPPORTUNITY LIMITED SUPPORT LIMITED SUPPORT SELECTIVE EMPHASIS LOW LOW MODERATE MODERATE HIGH HIGH MARKET OPPORTUNITY The R&D Effort Portfolio
Dimension High Low Level of Desire in Market Distinctive Similar Distinctiveness from Competitive Products Penetration Strategy Skimming Strategy Important Not Important Importance of Price to Market Easy Not Easy Ease of Duplicating Product Gradual Fast Return on Investment Objective When to Use a Penetration or Skimming Strategy for Pricing New Products
Promotion • Objectives • Promotion blend • Sales people, Kind, Number Selection, Training, Motivation • Advertising Targets, Kinds of ads, Copy thrust, Prepared by whom • Sales promotion • Publicity Product Place Price • Physical good • Service • Features • Quality level • Accessories • Installation • Instructions • Warranty • Product lines • Packaging • Branding • Objectives • Channel type • Market exposure • Kinds of middlemen • Kinds and locations of stores • How to handle transporting and storing • Service levels • Recruiting middleman • Managing channels • Objectives • Flexibility • Level over product life cycle • Geographic terms • Discounts • Allowances Strategy Decision AreasOrganized by the Four Ps