Download
1 / 2
0 likes | 10 Views
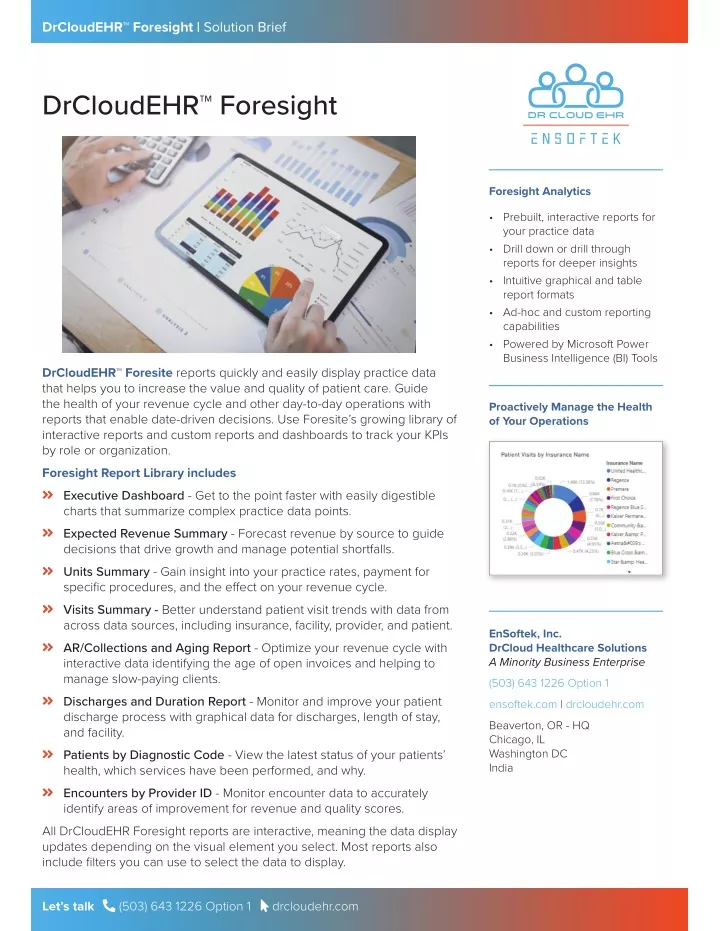
DrCloudEHRu2122 Foresite reports quickly and easily display practice data that helps you to increase the value and quality of patient care. Guide the health of your revenue cycle and other day-to-day operations with reports that enable date-driven decisions. Use Foresiteu2019s growing library of interactive reports and custom reports and dashboards to track your KPIs by role or organization.

E N D
DrCloudEHR™ Foresight | Solution Brief DrCloudEHR™ Foresight Foresight Analytics • Prebuilt, interactive reports for your practice data • Drill down or drill through reports for deeper insights • Intuitive graphical and table report formats • Ad-hoc and custom reporting capabilities • Powered by Microsoft Power Business Intelligence (BI) Tools DrCloudEHR™ Foresite reports quickly and easily display practice data that helps you to increase the value and quality of patient care. Guide the health of your revenue cycle and other day-to-day operations with reports that enable date-driven decisions. Use Foresite’s growing library of interactive reports and custom reports and dashboards to track your KPIs by role or organization. Foresight Report Library includes Angle-doExecutive Dashboard - Get to the point faster with easily digestible charts that summarize complex practice data points. Angle-doExpected Revenue Summary - Forecast revenue by source to guide decisions that drive growth and manage potential shortfalls. Angle-doUnits Summary - Gain insight into your practice rates, payment for specific procedures, and the effect on your revenue cycle. Angle-doVisits Summary - Better understand patient visit trends with data from across data sources, including insurance, facility, provider, and patient. Angle-doAR/Collections and Aging Report - Optimize your revenue cycle with interactive data identifying the age of open invoices and helping to manage slow-paying clients. Angle-doDischarges and Duration Report - Monitor and improve your patient discharge process with graphical data for discharges, length of stay, and facility. Angle-doPatients by Diagnostic Code - View the latest status of your patients’ health, which services have been performed, and why. Angle-doEncounters by Provider ID - Monitor encounter data to accurately identify areas of improvement for revenue and quality scores. All DrCloudEHR Foresight reports are interactive, meaning the data display updates depending on the visual element you select. Most reports also include filters you can use to select the data to display. Proactively Manage the Health of Your Operations EnSoftek, Inc. DrCloud Healthcare Solutions A Minority Business Enterprise (503) 643 1226 Option 1 ensoftek.com | drcloudehr.com Beaverton, OR - HQ Chicago, IL Washington DC India Let’s talk (503) 643 1226 Option 1 drcloudehr.com
DrCloudEHR™ Foresight | Solution Brief Drill Down on Data in Interactive Foresight Reports You can drill down on hierarchical data in Foresight graphical reports to gain additional insights. For example, in a bar chart, you can select a bar indicating a year and then drill down to update the graph to display data for each quarter, then each month, and then each day. Drill Through Data for Deeper Understanding The drill-through functionality in some Foresite charts enables you to zoom in and see category data in finer detail. When you drill through a graph, the application leads you to a focused page to view the data in table format. Foresight’s intiutive, graphical reports provide actionable intelligence at a glace. They also enable you to drill down for deeper insights into your practice data. Let’s talk (503) 643 1226 Option 1 drcloudehr.com