Download

1 / 26
320 likes | 480 Views
Land use/cover change effects on hydrology and water quality in Coastal Alabama. Latif Kalin, Ph.D. & Ruoyu Wang School of Forestry and Wildlife Sciences Auburn University. Outline. Motivation Objectives Study area Methodology Results Conclusions Acknowledgement. Motivation.

E N D
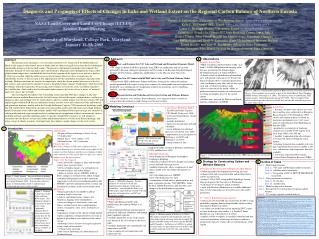
Land use/cover change effects on hydrology and water quality in Coastal Alabama Latif Kalin, Ph.D. & Ruoyu Wang School of Forestry and Wildlife Sciences Auburn University
Outline • Motivation • Objectives • Study area • Methodology • Results • Conclusions • Acknowledgement
Motivation • Coastal Alabama contains many pristine waters • Wolf Bay was granted Outstanding Alabama water status by Alabama Department of Environmental management in April, 2007. • Weeks Bay Watershed, fed by Fish and Magnolia Rivers, is the designated Outstanding National Resource Waters in the state of Alabama. • Bon Secour River watershed drains to the Bon Secour National Wildlife Refuge • Those waterbodies create a diverse environment fostering a rich array of precious species.
Motivation Threats to water resources in coastal Alabama LULC change due to population increase - Baldwin county experienced 43% increase in population from 1990 to 2000 - Transformation of agricultural and forested lands due to urbanization, increase in sod farming and golf courses Potential Consequences: 1. Water quantity: - Peak flows ↑ flood - Fluctuation in discharge salinity health and incubation of fishes 2. Water quality: - Shoreline sandy muddy destroy fish stock - Turbidity ↑ light for photosynthesis↓ ecosystem - Excess nutrients harmful algae bloom DO↓ hypoxia, eutrophication
Motivation • Urban areas in south Baldwin County commonly sit on watershed divides They have the potential of adversely impacting the headwaters of coastal creeks Foley sits at the divides of the Magnolia River, Bon Secour, and Wolf Bay watersheds. Significant portion of Fairhope is along the boundary of the Fish River watershed.
Motivation • Receiving bays in this area have regional and national significance. • Weeks Bay, the receiving bay of the Fish and Magnolia River watersheds, is designated as an Outstanding National Water • Wolf Bay recently became an Alabama Outstanding State Water • Bon Secour River watershed drains to the Bon Secour National Wildlife Refuge.
Objectives • How LULC has been changing along the eastern shores of Coastal Alabama over the past 20 years? • How LULC change and urbanization affects water quality/quantity in the eastern shores of Coastal Alabama (spatial variation)? • Which parts of the Coastal Alabama will be under more stress due to changes in hydrology and increased levels of nutrients and sediment loadings driven by LULC changes and urbanization?
Study Area • Weeks Bay Watershed (Fish River and Magnolia River Watersheds) • Home to more than 180 species of fish including 3 endangered species. • One of only 3 Outstanding National Resource Waters in the state of Alabama • Novoveska (2005) reported increase in nitrate concentrations by comparing data from the years 1998 and 2004 • Data from Nov-’08 to Mar-’10 suggests significant increase in TP concentrations and loadings in most tributaries of Fish River (Morrison, 2010). • Wolf Bay Watershed: • A sub-estuary of Perdido Bay with a connection to the Intracoastal Waterway • In December 2007 EPA designated Wolf Bay as an Outstanding AL Water • Primarily rural, but several municipalities exist with the watershed including Foley, Elbert, Gulf Shores and Orange Beach • Bon Secour Watershed: • Between Wolf Bay and Magnolia River Watersheds • With its headwaters reaching to the city of Foley, the watershed is under development stress • No known study relevant to water quality/quantity of the watershed exists.
Methodology • Set up, calibrate and validate SWAT model with past data in • Magnolia River watershed • Flow (Oct.1999 to Sep. 2009, USGS) • TSS, Nutrients (Feb. 2000 to Jan. 2002; Lehrter, 2003) • Fish River watershed (Spatial calibration) • - Flow (Jan 1990 to Dec. 1998, USGS) • - TSS, Nutrients (1994-1998; Basnyat 1998, Neil and Chandler 2003) • Transfer calibrated parameters from Magnolia River to Wolf Bay and Bon Secour watershed due to data scarcity (Wang and Kalin, 2010) • Explore LULC change effect on hydrology and water quality using LULC maps from 1995 and 2008
Precipitation ET Root zone Direct Runoff Vadose zone Lateral Flow Shallow aquifer Re-evaporation from shallow aquifer Return Flow Confining layer Percolation to shallow aquifer Deep aquifer Flow out of watershed Recharge to deep aquifer SWAT Model
Spatial pattern of hydrologic responses • Very uneven ET distribution between Fish River watershed and southern part of Baldwin County • Higher forest (greater LAI) and wetland (more available water for evaporation) percentage in the Fish River watershed • Different calibration strategies in Fish and Magnolia River watersheds • - Decrease simulated ET in the southern part to fulfill the lower streamflow under the condition of uneven distribution of measured precipitation. • Total streamflow indicates a reverse trend compared to ET
Annual mean precipitation distribution (1999 to 2009) 1557 mm 1147 mm
Spatial pattern of water quality responses • Spatial distribution pattern of sediment follows the trend of surface runoff. • MUSLE equation used in SWAT, the runoff volume and peak runoff rate are utilized to calculate sediment yield. • Significant uneven distribution between Fish River watershed and the southern part of coastal Baldwin county. • Different calibration strategies • Measured nutrient data from two driest years (2000 and 2001) was employed for calibration in the Magnolia river watershed • Higher N/P ratio is expected under low-flow condition, since phosphorus are mostly transported by surface runoff. • Due to data scarcity, although calibration strategy based on dry years’ nutrient data may not be suitable for wet conditions, we still utilized it for this 11 years period. • In contrast, in the Fish River watershed, nutrient data was available from 1994 to 1998, which could be considered long enough containing both dry and wet conditions.
Relative Changes in Hydrology and Water Quality due to LULC Changes • ET reduction in southern part of coastal Baldwin county is caused by increase in urbanization. • Surface runoff presents increasing trend in the southern part of Baldwin County, which is compatible with the urbanization trend. • No decreasing trend for groundwater. • The decreasing or increasing trend of sediment is compatible with the LULC change; urban expansion usually caused increases in sediment yields. • The relative change of TN loads is closely related to the variation of crop land area, as mineral fertilization in crop land is an important source of mineral nitrogen loadings • TP pattern is affected both by cropland fertilization and urbanization.
Annual absolute change of hydrologic responses at subbasin level
Conclusions • The three watersheds in the southern part of coastal Baldwin County experienced stronger urbanization (7.3%, 11.2% and 6.4%) from 1995 to 2008 than the Fish River watershed (1.8%). • Absolute responses of hydrology and water quality may not be accurate enough to explore LULC change effects due to discrepancies between rainfall datasets and the limitation of measured nutrient data. Relative and absolute change of hydrologic and water quality responses at subbasin level were employed to investigate LULC change effects. • LULC change substantially influences hydrologic and water quality responses at subbasin level. Replacing higher ET generating LULC types (forest, crop land and shrub) with urban areas leads to ET reduction and in turn increase in total stream flow. LULC change, especially urbanization causes a redistribution of streamflow. • Sediment yield was closely related to surface runoff and soil erosion. Urbanization, deforestation and growth of cropland will increase sediment yields. TN and TP loadings are more affected by NP fertilization and urbanization.
Conclusions • At watershed scale, the Fish River Watershed had increase in ET and decrease in flow, contrary to the other three watersheds in southern coastal Baldwin County. • Decrease in sediment load (-6.5%) is predicted from 1995 to 2008 in the Fish River watershed, while a small increasing trend (2.0%) is found in the Magnolia River watershed. Other two watersheds showed marginal change in sediment yield. • TN loadings reflected a decline trend in the southern part of coastal Baldwin County, while substantial growth (11.4%) in the Fish River watershed. All four watersheds experienced TP increase from 1995 to 2008. • Considering the receiving water body, Weeks Bay experienced flow and sediment reduction due to LULC change, while TN and TP loadings showed somehow growth trend. Streamflow draining to Bon Secour and Wolf Bay increased slightly, and in turn resulted in marginal change of sediment loadings. TN loadings reflected a significant declining trend, while TP loadings increased moderately.
Acknowledgements • AL Experiment Station • Larry Prince • Shufen Pan • Harsh Singh