Download
1 / 25
250 likes | 377 Views
Continued Development of Tropical Cyclone Wind Probability Products. John A. Knaff – Presenting CIRA/Colorado State University and Mark DeMaria NOAA/NESDIS Presentation at 60 th Interdepartmental Hurricane Conference Mobile, AL 22 March 2006. Outline. Training Activities

E N D
Continued Development of Tropical Cyclone Wind Probability Products John A. Knaff – Presenting CIRA/Colorado State University and Mark DeMaria NOAA/NESDIS Presentation at 60th Interdepartmental Hurricane Conference Mobile, AL 22 March 2006
Outline • Training Activities • Verification Activities • Results/insights from examination of hurricane warning break points 22 March 2006 - Mobile, AL
Training Activities • Mark DeMaria coordinated with Rick Knabb to provide feedback on a TPC/NHC training session. • Several cases rerun for 2004 and 2005 • For Pablo Santos, Miami WFO for an experimental algorithm that uses the probabilities. • Web page with examples and a product description http://rammb.cira.colostate.edu/projects/tc_wind_prob 22 March 2006 - Mobile, AL
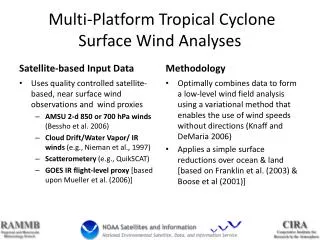
Verification: Current Status • Developed: • Input data handling (GRIB, ATCF….) • Statistical Methods • Scalar measures of skill, accuracy, confidence • Conditional measures • Methods to assess deterministic forecasts • Remaining • Treatment of the OFCL forecast & wind radii through 5 days. • Integrating the pieces. • How to Interpret the statistics and optimize use. 22 March 2006 - Mobile, AL
Statistical methods: Probability Bias • Mean Forecast Probabilities (Fi) minus the Mean Observed Frequencies (Ei) = 1 or 0 Determines if the probabilities over/under forecast the outcome. 22 March 2006 - Mobile, AL
Statistical Methods: Brier Score • Mean of square of the Forecast Probabilities (Fi) minus the Observed Frequencies (Ei) = 1 or 0 Measures the Mean Square Errors (Accuracy) associated with a probabilistic forecast 22 March 2006 - Mobile, AL
Statistical Methods: Brier Skill Score • A scalar skill score comparing a given Brier Score with the Brier Score of a reference forecasts (OFCL, CLIPER etc.). Assess relative accuracy (skill) of a probabilistic forecast with respect to a reference forecast. 22 March 2006 - Mobile, AL
Statistical methods: Discrimination Distance • Distance between the mean forecast probability (F) for all event (E) and all non-events (E’). Measures the ability of a forecast scheme to discriminate events. 22 March 2006 - Mobile, AL
Statistical Methods: Conditional Distributions Observed frequency of events Bins of Forecast Probabilities 22 March 2006 - Mobile, AL
Statistical Methods: Relative Operating Characteristics • A series of 2x2 contingency tables, which are conditional on a range of forecast probabilities are constructed. • For instance a warning would be issued if the probability exceeded 1,2,3,4,…100 % The results of the contingency tables can be quantified in terms of hit rate (hr) = h/(h+m) and false-alarm rate (far)=f/(f+c) A plot of far vs. hr can be created and a skill score created from the area under the curve. 22 March 2006 - Mobile, AL
Statistical Methods: ROC diagram & Skill Score ROC Skill Score skill ,where A is the area under the curve No skill Mason and Graham (1999) 22 March 2006 - Mobile, AL
Verification Procedure: Test Dataset • Dataset • 5-day cumulative 64-kt wind probabilities were generated for 342 coastal break points (195 official breakpoints + 147 additional points) • These were analyzed when warnings were issued for the 14 storms to the right • N=128250 points 22 March 2006 - Mobile, AL
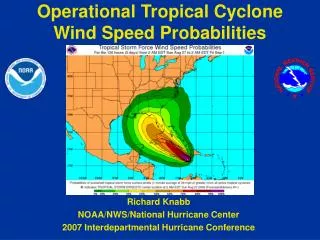
Verification Procedure: Summary Skill Measures ROC Bias = 0.893 (under forecasts) BS = 0.0248 BSOFCL= 0.0346 BSzero = 0.0392 BSSOFCL = 28.30% BSSzero= 36.75% Relative Operating Characteristics 5-d Cummulative Probabilities for Landfalling Atlantic TC 2004-2005 22 March 2006 - Mobile, AL
Verification Procedure: Conditional Distribution of Break Point Probabilities Slight under forecast of probabilities for this dataset – due to Wilma 22 March 2006 - Mobile, AL
Verification Procedure: Summary • The probabilities are skillful • Brier Skill Score 28% more accurate than the OFCL deterministic forecast • Note 50% of the OFCL forecasts verified • ROC Skill Score 88% • The discrimination distance d=26% is large • Probabilities slightly under forecast and are well calibrated for this limited dataset 22 March 2006 - Mobile, AL
Can the wind speed probabilities be used do decrease the area warned or increase lead time? 22 March 2006 - Mobile, AL
Probability Model for NHC Hurricane Warnings NHC storm total hurricane warning lengths 1963-2005 NHC storm average hurricane warning lead times 1963-2005 Since 2000 warning areas have decreased and lead times increased. 22 March 2006 - Mobile, AL
Discrimination Distance N=5025 N=123225 Warned Break Points (Warnings in Place) Unwarned Break Points (Warnings in Place) 22 March 2006 - Mobile, AL
Why are there so many low probabilities at the break points? ? 22 March 2006 - Mobile, AL
Distribution of Probabilities at the Ending Break Points ? 22 March 2006 - Mobile, AL
Example: Hurricane Rita 00UTC 24 Sep. 12 UTC 23 Sep. 00 UTC 23 Sep. 12 UTC 22 Sep t=0 at landfall Warnings are brought down too slowly in this case.
Summary of Warning Break Points • Probabilities are useful in the watch/warning process. • Objectively assign of the warnings at fixed lead time? • Average at warnings = 28% • Average at end points of the Warnings = 9% • It appears that warnings can be dropped sooner, thus decreasing the area warned area. 22 March 2006 - Mobile, AL
Future Plans • Seasonal Verification Code • See what we can learn from the verification. • Report to this audience Questions? 22 March 2006 - Mobile, AL