Download
1 / 24
240 likes | 350 Views
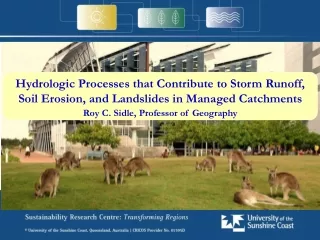
Evaluation of Overland Flow Paths Generated from Multiresolution DEMs. J.M. Shawn Hutchinson 1 , Stacy L. Hutchinson 2 , and I.J. Kim 2 1 Department of Geography and 2 Department of Biological and Agricultural Engineering Kansas State University Manhattan, Kansas 66506-2907.

E N D
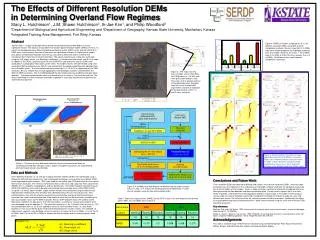
Evaluation of Overland Flow Paths Generated from Multiresolution DEMs J.M. Shawn Hutchinson1, Stacy L. Hutchinson2, and I.J. Kim2 1Department of Geography and 2Department of Biological and Agricultural EngineeringKansas State University Manhattan, Kansas 66506-2907
The Problem: NPS Pollution • Largest contributors to surface water impairment are nonpoint source (NPS) pollutants – sediment, nutrients, pathogens, other chemicals “40% of streams in US are considered contaminated..” Percent of Impaired Waters (1998) HUC 8 Scale www.epa.gov/iwi/2000aug/iv22_usmap.html Department of Geography, Kansas State University
One Solution: VBS • Vegetated buffer systems (VBS) – common and sustainable BMP for mitigating NPS pollutant transport Department of Geography, Kansas State University
VBS Illustrated Design standards from USDA Farm Service Agencyand Natural Resource Conservation Service Source: NRCS Photo Gallery Shrubs – nutrient removal Zone 3 Zone 2 Zone 1 Trees – bank stabilization Grass – control runoff, sediment Department of Geography, Kansas State University
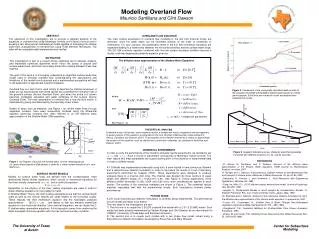
Assumptions… Uniform Sheet Flow A = W x L Concentrated Flow A = W x L x β β = A – Ineffective Area L W Hydrologic and Vegetation Conditions Department of Geography, Kansas State University
Overall Objectives • To determine optimal DEM spatial resolution to model soil erosion processes • To evaluate the efficiency of different VBS designs Department of Geography, Kansas State University
N False-Color CompositeLandsat TM 5; June 7, 1997
DEMs and Hydrology • Zhang and Montgomery (1994) • 10 m resolution is recommended • Kuo et al. (1999) • Hillslope curvature an important factor • Runoff volume is affected most by DEM resolution during dry seasons • Moglen et al., (2001) • Coarser resolution DEMs tend to overestimate peak stream discharge Department of Geography, Kansas State University
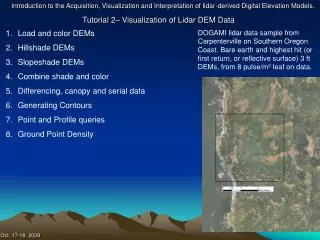
DEM Creation • GPS data collected on-site at 3m intervals using DGPS unit • Raster DEMs created from interpolated point datasets of varying density: 30m, 10m, 3m • ArcHydro tools • Flow paths - D8 method 7 6 8 5 1 4 3 2 Department of Geography, Kansas State University
30 mUSGS 30 m 10 m 3 m
Hmmmm…. • Best resolution DEM for representing flow processes and ability to capture/assess small (sub-pixel) BMPs • Traditional “flow accumulation” flow paths not sufficient • Compounding assumptions – effective VBS relies on sheet overland flow • Observed channelized flow (rill erosion) – need to identify where channelized flow begins Department of Geography, Kansas State University
Time of Concentration • Time of concentration • twatershed = toverland flow + tchannel flow + tdetainments • tov = equilibrium time when rainfall intensity equals runoff discharge rate • Differences in the observed and computed tov results from the transition from sheet to concentrated flow • Sheet: [tov measured] ≈ [tov-computed] • Concentrated: [tov measured] >> [tov-computed] Department of Geography, Kansas State University
Kinematic Wave Equation • Federal Aviation Administration (1970) • tov = [1.8(1.1-C)L0.50]/S0.333 • C: rational method runoff coefficient • Morgali and Linsley (1965); Rogan and Duru (1970) • tov = [0.93(nL)0.6]/[i0.4S0.5] Primary Variables: n = Manning’s coefficient L = slope length S = slope i = rainfall intensity Department of Geography, Kansas State University
When Sheet Flow? • Ignoring impervious surfaces… • Izzard (1946): iL (in/hr x ft) < 500 • Not fully verified (Rogan and Duru 1972) • SCS TR-55 (1986): Slope length < 300 ft • Lacks justification (McCuen and Spiess 1995) Department of Geography, Kansas State University
Kinematic Wave Criteria • McCuen and Spiess (1995) • tov= [0.93(nL)0.6] / [i0.4(S0.5)0.6] • Assessed measured and computed tov from 59 field sites and lab experiments Department of Geography, Kansas State University
So What? • Where calculated values of nLS-0.5 on a hillslope (or plot) is less than 100, sheet flow is the dominant flow type. • Apply this measure to guide VBS placement within a watershed • Good: Independent of i (rainfall intensity) • Problem: Spatial estimates of Manning’s n Department of Geography, Kansas State University
Parting Shot… • Flow paths from cell accumulation routines don’t address energy required for initiating rill erosion • Identifying nLS-0.5 threshold will help place VBS where they can be most effective, and where model assumptions are valid – sheet flow dominated slopes • Extend nLS-0.5 method to identify gully erosion sites… Department of Geography, Kansas State University
Acknowledgements • Strategic Environmental Research and Development Program • “Assessing the Impact of Maneuver Training on NPS Pollution and Water Quality” • Project #CP-1339 • Geographic Information Systems Spatial Analysis Laboratory, Kansas State University Department of Geography, Kansas State University
Applying the nLS-0.5 Criteria Department of Geography, Kansas State University
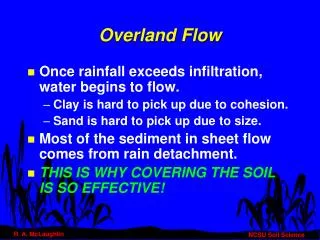
Operational Requirements • Hydrologic Condition • Maintaining uniform sheet flow through buffer • Overland flow often becomes concentrated (Dillaha et al. 1986; Fabis et al. 1993; Dosskey et al. 2002) • Vegetative Condition • Maintaining healthy dense vegetation growth • Vegetation condition varies within and between years Department of Geography, Kansas State University
Models assume sheet flow • Best resolution DEM for representing flow processes and ability to capture small BMPs • Traditional “flow accumulation” flow paths not a sufficient for • Assuming VBS effective in removal – but it’s assumption is overland flow • Observed channelized flow – need to understand where channelization initiates and not violate model assumptions • Rill erosion (up to 200 mm deep) is onset of channelization = biggest cause of sediment transport (enough water with enough energy to move dirt) Department of Geography, Kansas State University