Download
1 / 13
130 likes | 142 Views
Multiple Representations of Functions. Essential Questions. How do we translate between the various representations of functions? How do we solve problems by using the various representations of functions?. Holt McDougal Algebra 2. Holt Algebra 2.

E N D
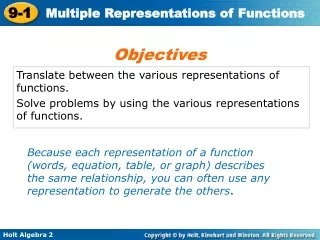
Multiple Representations of Functions Essential Questions • How do we translate between the various representations of functions? • How do we solve problems by using the various representations of functions? Holt McDougal Algebra 2 Holt Algebra 2
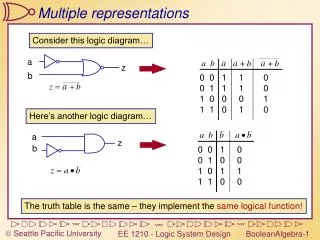
Because each representation of a function (words, equation, table, or graph) describes the same relationship, you can often use any representation to generate the others.
Distance is equal to minus 80 3 meters per second. Recreation Application Janet is rowing across an 80-meter-wide river at a rate of 3 meters per second. Create a table, an equation, and a graph of the distance that Janet has remaining before she reaches the other side. When will Janet reach the shore?
Recreation Application Janet is rowing across an 80-meter-wide river at a rate of 3 meters per second. Create a table, an equation, and a graph of the distance that Janet has remaining before she reaches the other side. When will Janet reach the shore?
Recreation Application The table shows the height, in feet, of an arrow in relation to its horizontal distance from the archer. Create a graph, an equation, and a verbal description to represent the height of the arrow with relation to its horizontal distance from the archer. First differences 53.25 30.75 8.25 –14.3 –37 Second differences –22.5 –22.5 –22.55 –22.7 Step 1 Use the table to check finite differences. Since second differences are close to constant, use the quadratic regression feature to write an equation.
Recreation Application The table shows the height, in feet, of an arrow in relation to its horizontal distance from the archer. Create a graph, an equation, and a verbal description to represent the height of the arrow with relation to its horizontal distance from the archer. Step 2 Write an equation. Use the quadratic regression feature. y = –0.002x2 + 0.86x + 6.52
100 0 0 500 Recreation Application The table shows the height, in feet, of an arrow in relation to its horizontal distance from the archer. Create a graph, an equation, and a verbal description to represent the height of the arrow with relation to its horizontal distance from the archer. Step 3 Graph the equation. The archer shoots the arrow from a height of 6.55 ft. It travels horizontally about 220 ft to its peak height of about 99 ft, and then it lands on the ground about 500 ft away.
Remember! Remember! The point-slope form of the equation of a line is y – y1 = m(x – x1), where m is the slope and (x1, y1) is a point on the line. (Lesson 2-4) First differences are constant in linear functions. Second differences are constant in quadratic functions. (Lesson 5-9)
Using Multiple Representations to Solve Problems A hotel manager knows that the number of rooms that guests will rent depends on the price. The hotel’s revenue depends on both the price and the number of rooms rented. The table shows the hotel’s average nightly revenue based on room price. Use a graph and an equation to find the price that the manager should charge in order to maximize his revenue. The data do not appear to be linear, so check finite differences.
Using Multiple Representations to Solve Problems A hotel manager knows that the number of rooms that guests will rent depends on the price. The hotel’s revenue depends on both the price and the number of rooms rented. The table shows the hotel’s average nightly revenue based on room price. Use a graph and an equation to find the price that the manager should charge in order to maximize his revenue. Revenues 21,000 22,400, 23,400 24,000 First differences 1,400 1,000 600 Second differences 400 400 Because the second differences are constant, a quadratic model is appropriate. Use a graphing calculator to perform a quadratic regression on the data.
Using Multiple Representations to Solve Problems A hotel manager knows that the number of rooms that guests will rent depends on the price. The hotel’s revenue depends on both the price and the number of rooms rented. The table shows the hotel’s average nightly revenue based on room price. Use a graph and an equation to find the price that the manager should charge in order to maximize his revenue. Use the Maximum Feature to locate the maximum. Occurs when x = 110 The manager should charge $110 a night per room.