Download
1 / 19
190 likes | 316 Views
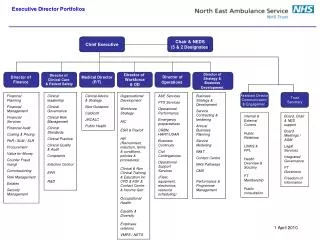
Kirsten Fleming Executive Director. Jonathan Thomas Assistant Director of Intervention. Alice Gabbard Director of Intervention. Our Primary Goal. To Increase Student Achievement.

E N D
Kirsten Fleming Executive Director Jonathan Thomas Assistant Director of Intervention Alice Gabbard Director of Intervention
Our Primary Goal To Increase Student Achievement
From: Hibpsham, T. (Aug. 27, 2007). A Brief Review of the Preparation of Kentucky Mathematics and Science Teachershttp://www.kyepsb.net/dataresearch/journals/index.asp “Kentucky students continue to lag behind the national average in mathematics at both the 4th and 8th grade levels. Estimates by the Kentucky Council on Postsecondary Education of the proportion of entering freshmen requiring developmental mathematics at Kentucky institutions of higher education indicate that 41% of all entering students -- and 35% of recent high school graduates -- required these services, a figure deemed unacceptably high by CPE.”
From: Ball, D. L. (1990). The mathematical understanding that prospective teachers bring to teacher education. The Elementary School Journal, 90, 449-466 “Assuming that the content of first-grade mathematics is something that any adult understands is to doom school mathematics to a continuation of the dull, rule-based curriculum that is so widely criticized.”
“In fact, teaching mathematics to students in the earliest grades is a demanding process that requires surprisingly high levels of mathematical knowledge. Elementary teachers must impart mathematical knowledge to children who may have difficulty understanding the content regardless of how it is delivered, and teachers need to have sufficiently broad understanding of the content to be able to represent it in multiple ways .” From: Ball, D. L. (1990). The mathematical understanding that prospective teachers bring to teacher education. The Elementary School Journal, 90, 449-466
DIAGNOSTIC INTERVENTION MISSION STATEMENT The goal of the state mathematics diagnostic intervention program is to expand the capacity of teachers to assess a child’s current status and adjust instruction accordingly.
86 MITs; 45 from 2006 and 41 from 2007 • 64 Number Worlds; 12 Math Recovery; 10 Both
Fall 2007 Intervention Students Assessed by 86 MITs
Scaled Scores n-comparison = 127 n-intervention = 86 PRE* National Percentile Intervention: n/a Comparison: n/a Stanine Intervention: n/a Comparison: n/a POST National Percentile Intervention: 57 Comparison: 39 Stanine Intervention: 5 Comparison: 4 * Percentile and Stanine conversions are not available for this test.
Scaled Scores PRE National Percentile Intervention: 6 Comparison: 14 Stanine Intervention: 2 Comparison: 3 POST National Percentile Intervention: 43 Comparison: 38 Stanine Intervention: 5 Comparison: 4 n-comparison = 252 n-intervention = 225
FIRST GRADE TERRA NOVA ACHIEVEMENT BY PROGRAM PRE National Percentile Math Recovery: 9 Number Worlds: 5 Comparison: 14 Stanine Math Recovery: 2 Number Worlds: 2 Comparison: 3 POST National Percentile Math Recovery: 70 Number Worlds: 34 Comparison: 38 Stanine Math Recovery: 6 Number Worlds: 4 Comparison: 5 Analysis performed by University of Cincinnati Evaluation Services Center FIRST GRADE TERRA NOVA ANALYSIS BY PROGRAM Scaled Score Scaled Scores 454 454 554 +100 554 n=66 n=66 70 437 437 519 +82 n=159 n=159 519 9 34 465 465 Number Worlds t = 23.062 df = 158 Significance = .000 Math Recovery t = 19.10 df = 65 Significance = .000 Comparison Group t = 27.2 df = 251 Significance = .000 524 +59 n=252 524 n=252 5 38 14 NUMBER WORLDS NUMBER WORLDS MATH RECOVERY MATH RECOVERY Mean Student Group Size 6.94 Students Mean Student Group Size 6.94 Students Mean Instructional Time per Student 91.25 hours Mean Instructional Time per Student 91.25 hours Mean Student Group Size 1.00 Students Mean Student Group Size 1.00 Students Mean Instructional Time per Student 28.27 hours Mean Instructional Time per Student 28.27 hours National Percentile n=66 n=159 n=252
Potential Service Model Instructional Mathematics Coaches Highly Trained MITs K-12 Math Teacher Leaders RTI TIER 3 Cognitive Coaching All Schools All Schools RTI TIER 2 Teaching and Learning Resources Differentiation RTI TIER 1 PD in Content and Pedagogy Community PD for Family/Community Involvement Evaluation and Research Shared Vision
http://kentuckymathematics.org Thank you for your time and attention. Please visit us online at: