Download
1 / 33
350 likes | 893 Views
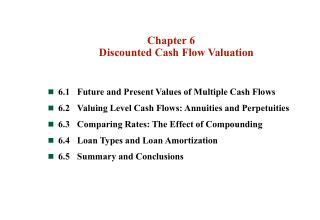
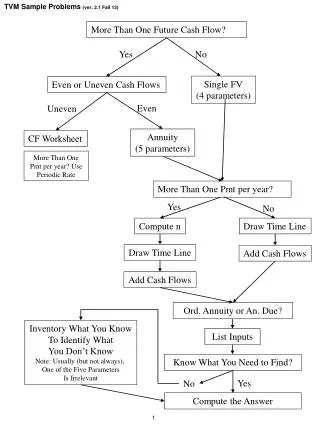
Present value of future cash flow. r = discount rate n = number of periods. Discounting: calculation of present values Compounding: calculation of future values. n. n. n. n. n. PmT. PmT. PmT. PmT. PmT. In advance. PmT. PmT. PmT. PmT. PmT. In arrears. CF t. CF 0. Annuities.

E N D
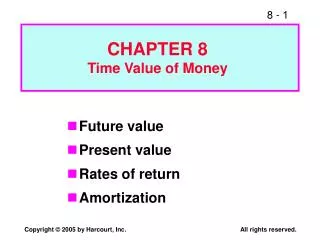
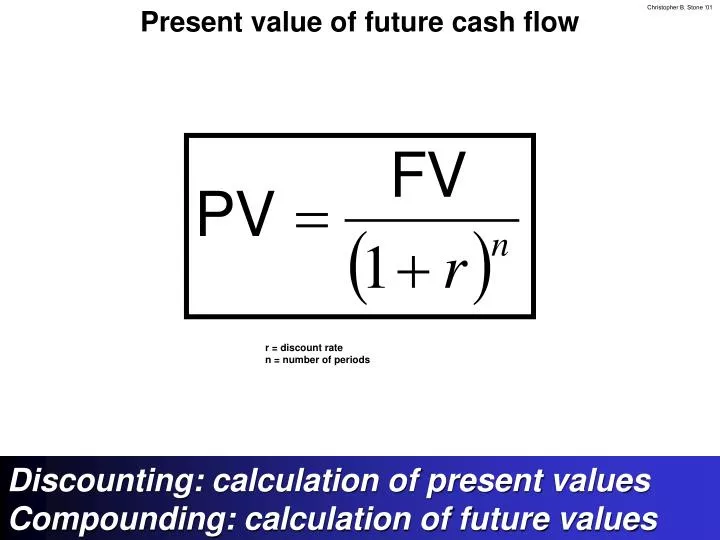
Present value of future cash flow r = discount rate n = number of periods Discounting: calculation of present values Compounding: calculation of future values
n n n n n PmT PmT PmT PmT PmT In advance PmT PmT PmT PmT PmT In arrears CFt CF0 Annuities
Internal rate of return IRR is that unique discount rate which, when applied to a series of future cash flows, yields a net present value of 0.
Financial management rate of return Only Series A is a “pure” IRR Series B and Series C have money extracted from the system Series C has money invested in the system after t0 The IRR model assumes 1) That money invested in the system is held in an account bearing interest at the IRR before being invested; 2) That money extracted from the system is re-invested in an account yielding the IRR. FMRR bifurcates negative and positive cash flows
Financial management rate of return PV’ed at safe rate (50) (50) PV FV (7.18) (7.18) (7.18) (7.18) (107.18) Future valued at re-investment rate FMRR > re-investment rate for worthwhile investments
Hurdle rates The earnings you forego by deploying capital in a different way The rate you must get on an investment for the deal to make sense If hurdle rate < IRR, NPV is positive
Sensitivity analysis If HR<IRR, + NPV If you discount your cash flows @ the HR and get a + NPV, the NPV represents your profit over the life of the deal. NPV @ HR is the positive cushion you have Annuitize this figure (calculate PmT) to get Net Uniform Series (NUS)
Capital asset pricing model Cost of capital = Risk-free return + compensation for additional risk beyond a USG bond Cost of capital = Risk free return + (β x market risk premium) Cost of capital = Risk free return + (β x margin by which stock market exceeds risk-free return Cost of capital Co-variance of returns against the portfolio (departure from the average) B < 1, security is safer than S&P 500 average B > 1, security is riskier than S&P 500 average Average rate of return on common stocks (S&P 500) Risk-free return USG securities Cost of equity capital = return expected on firm’s common stock
Benefits of FIFO and LIFO Must use the same method for financial & tax accounting
Depreciation methods = Cost-salvage value Useful life = Cost-salvage value * remaining years of useful life n(n+1) 2 Keyed off the remaining balance in each year AFTER depreciation Does NOT use salvage value
Straight line & sum of the years depreciation Straight-line Sum of the years
Declining balance depreciation $12,000 x .375 = $4,500
Merger accounting Defeat hostile takeovers by ensuring the combination doesn’t qualify for pooling
Pooling method Pooling: Uses book value, A inherits T’s retained earnings
Purchase method Purchase: Uses FMV, A doesn’t inherit T’s retained earnings
Liquidity ratios Quick ratio Current ratio Current assets Current liabilities Current assets - inventory Current liabilities = = Cash flow liquidity ratio Cash flow from operations* Current liabilities = *From the cash flow statement
Leverage ratios Debt ratio Liabilities Assets = Debt/equity ratio Liabilities Net worth =
Financial leverage index Is a company trading positively on its leverage? I.e., is it bringing in capital at less than the return? Financial leverage index Return on equity Adjusted return on assets = Net earnings* / equity** [Earnings + interest (1-tax rate)] / assets = * Note this does not include pfd div **Or market cap
Activity ratios Accounts receivable turnover Accounts payable turnover Net sales* Accounts receivable Total expenses* Accounts payable = = Inventory turnover COGS* Inventory = *From the income statement
Operating cycle Avg. amount of time inventory is outstanding + Avg. amount of time receivables are outstanding Operating cycle = Capital infusion $ Accounts receivable Inventory Sale
Cash conversion cycle Avg. amount of time inventory is outstanding + Avg. amount of time receivables are outstanding - (Avg. amount of time payables are outstanding) Cash conversion cycle = Capital infusion $ Accounts payable Accounts receivable Inventory (Payment) Sale
Profitability ratios Gross profit margin Gross profit Gross sales = This is very much driven by variable costs / cost of goods sold. Overhead is NOT included. Measures profitability A business can be profitable and still trade negatively on its leverage
P/E ratio Stock price per share Earnings per share = P/E ratio Earnings + interest Assets Return on total assets =