Download
1 / 14

E N D
Profitability Profitability analysis (also sometimes referred to as financial analytics) is a relatively new cross-enterprise discipline that unlocks profit potential to drive performance. Once a management and accounting-driven reporting exercise, it is now being used to help all parts of a company gain the insight necessary to deploy limited resources in pursuit of the most profitable opportunities. Company departments and divisions, such as sales, marketing, operations and engineering, can use profitability analysis to answer simple profit-focused questions in the context of Profitability Profitability analysis primarily involves developing profitability models that depict business problems. Such a paradigm requires calculating various analysis scenarios that are based on who is ultimately using the analytical insights.
Tools to profitability analysis so that they can effectively • Assess the right profitability measures that optimize business performance. • Move from merely a costing-oriented profitability reporting exercise to a forward-looking profitability modeling paradigm. • Undertake profitability analysis for different dimensions of profitability (for example, customer, channel, product and so on). • Use statistical and advanced analytical techniques to predict profitability outcomes better and thereby work towards optimizing resource inputs. • Tie profitability analysis to all other enterprise performance management processes such as planning, consolidation and control, strategy management
Technique for Profitability Analysis • Cost Volume Profit Analysis • Target Profit Analysis • Du-pont Analysis
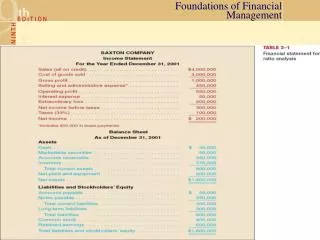
Cost Volume Profit Analysis • Voltar company manufactures and sells a telephone answering machine. The company’s contribution format income statement for the most recent year is given below: • Management is anxious to improve the company’s profit performance and has asked for an analysis of a items.
Cost Volume Profit Analysis • Required: • 1. Compute the company’s CM ratio and v.exp. Ratio • 2. Compute the company’s BEP in both units and sales dollars
Cost Volume Profit Analysis 1. CMR= CM/SP=$15/$60=25% • VER=VE/SP=$45/$60=75% 2. Sales= V.Exp.+ F.Exp + Profit $60Q=$45Q+$240000+$0 $15Q=$240000 Q=16000 units or at $60 per unit, $960000
Target Profit Analysis • Refer to the data of Voltar Company. Assume that nest year management wants the company to earn a minimum profit of $90,000. how many units will have to be sold to meet this target profit figure? • Equation Method: Sales= V.Exp.+ F.Exp + Profit $60Q=$45Q+$240000+$90000 $15Q=$330000 Q=22000 units or at $60 per unit, $960000 • Contribution Margin Method: = =22,000 units
DuPont System of Analysis • Objective: Find out why a company’s profitability, as measured by ROA and ROE, is higher or lower than the industry average ROA or ROE or last year’s company ROA or ROE. • Example: Kohls – company wanted to grow fast, and was able to grow ever faster than its planned growth rate because its profitability as measured by ROE was higher than expected • DuPont formula: ROA = Net Profit Margin x Total Asset Turnover • Pricing and expense control captured by Net Profit Margin • Efficiency of asset use captured by Total Asset Turnover • Company’s over- or underperformance on ROA is due to one or both of these causes, or “drivers”
DuPont System of Analysis • Modified DuPont formula: ROE = Net Profit Margin x Total Asset Turnover x Financial Leverage Multiplier • Financial Leverage Multiplier, or “Equity Multiplier” as some call it, is really a debt ratio • More assets financed with debt mean less assets financed with equity, so higher this number is, the greater the use of financial leverage • Company can “lever up” ROE by using more debt • Company’s over- or underperformance on ROE is due to one of three causes, or “drivers” • NPM • TAT • FLM • Compare company to itself over time and to industry for most recent year when doing your DuPont analysis of ROE
DuPont System of Analysis • Example: • Kohls has NPM of 7%, TAT of 2, FLM of 1.5 • Department stores industry has NPM of 8%, TAT of 1.5, and FLM of 1.25 • Format to show your DuPont analysis: • Conclusion: Kohls has a much better ROE than its industry because (1) its use of assets is more efficient (it generates more sales per dollar of asset investment) and (2) because it uses more debt financing. Kohls pricing or expense control are inferior to the industry, however, and the use of debt constitutes a greater risk for Kohls because it may not be able to handle the interest payments and principal repayment.
Productivity and Profitability Relationship Profitability refers to profit earning capacity of an enterprise. It is one of the best measurements of evaluating of overall performance of an enterprise. But measurement of productivity alone cannot identify the causes of productivity changes. Profitability may be changed due to productivity or price cost movement. Therefore it is necessary to segregate profitability into productivity and price recovery. Considering the relationships among 3ps (Productivity, Profitability and Price recovery) profitability is defined as the product of productivity and price recovery.
Productivity and Profitability Relationship The following demonstrates this relationship: • Output Value = Output Quantity x Unit Price Profitability = Productivity x Price Recovery Input Value = Quantity Used x Unit Cost • Where: • Profitability = • Productivity = • Price Recovery =