Download
1 / 27
280 likes | 466 Views
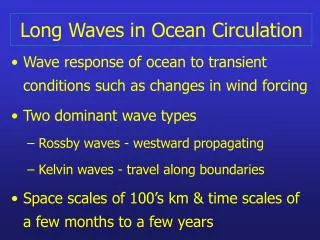
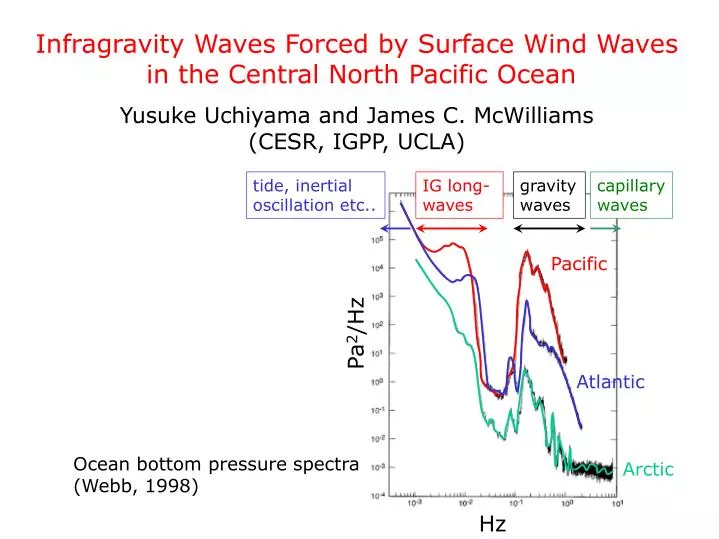
tide, inertial oscillation etc. IG long-waves. gravity waves. capillary waves. Pacific. Pa 2 /Hz. Atlantic. Arctic. Hz. Infragravity Waves Forced by Surface Wind Waves in the Central North Pacific Ocean Yusuke Uchiyama and James C. McWilliams (CESR, IGPP, UCLA).

E N D
tide, inertial oscillation etc.. IG long-waves gravity waves capillary waves Pacific Pa2/Hz Atlantic Arctic Hz Infragravity Waves Forced by Surface Wind Waves in the Central North Pacific Ocean Yusuke Uchiyama and James C. McWilliams (CESR, IGPP, UCLA) Ocean bottom pressure spectra (Webb, 1998)
What are infragravity (IG) long-waves: • Non-linear interaction between short primary waves • (modulation) + varying topography ~ O(10-2)-O(10-3)Hz • Forced (bound) & free waves [Herbers et al, 1994; 1995] • Surf beat (surf zone) [Munk, 1949; Huntley et al., 1981] • Edge waves (trapped & leaky) [Bowen & Inmann, 1971] IG waves are generally known to have small amplitudes in deep ocean only << O(10-2) m. amplified significantly in nearshore regions Continuous seismic oscillations ~ “Earth’s hum”~M6 [Webb, 1998; Rhie and Romanowicz, 2004; Tanimoto, 2005] • Is the hypothesis proposed by seismologists true? • If so, how large is amplitude of IG waves? • Dynamics: bound vs. freely propagating IG waves?
Asymptotic equations developed in MRL04 • (McWilliams, Restrepo and Lane, 2004) • wave-averaged effects on currents & long waves • primary waves ~ 2nd order inwave slope (e =Ak) • scale separation in time and horizontal space • Eulerian reference frame observations & models • Vortex force (curl u Vst) • Bernoulli head ~ pressure correction (set-up/down) • Evolution due to Stokes drift • vs. Classical “radiation stress” formalism • (c.f. Longuet-Higgins and Stewart, 1960, 1962, 1964)
Equations for long-wave dynamics derived in MRL04 Momentum: Continuity: Wave-averaged term: Momentum: wave-averaged term Continuity:
Evaluation of the primary wave-averaged forcing term Using the ECMWF 2D wavenumber (frequency-directional) spectral data, G (s, q) [m2 s /rad], every 6 hours on a 1.5o grid (w/ interpolation) Stokes transport: wave set-down: Data source: ECWMF/UCAR (http://dss.ucar.edu/datasets/ds123.0/)
Numerical Configuration • based on 2D-ROMS with the wave-averaged term • containing advection, Coriolis, bottom drag terms • ~1/8o geographical grid (1568 1152 cells) • Dte=18 s Bathymetry h (km) of the Pacific Ocean open boundary with a modified Orlanski condition
zlw zs & Tst Tm Hs & k wave energy IG wave solution at 0 AM UTC on 27thJulian day, 2000
zlw zs & Tst Tm Hs & k wave energy IG wave solution at 0 AM UTC on 28thJulian day, 2000
zlw zs & Tst Tm Hs & k wave energy IG wave solution at 0 AM UTC on 29thJulian day, 2000
zlw zs & Tst Tm Hs & k wave energy IG wave solution at 0 AM UTC on 30thJulian day, 2000
zlw zs & Tst Tm Hs & k wave energy IG wave solution at 0 AM UTC on 31stJulian day, 2000
January 31, 2000 Tst and zs • Seismically quiet, but “hum” was apparent in the IG frequency band ~ M6 (Rhie & Romanowics, 2004) • Forced IG waves are evident, but free IG waves are unclear and amplitude is small ~10-4m. wave-averaged term, F simulated zlw
Time series of zlw at two locations on January 31, 2000 (1) (2)
(1) Off Alaska (230o02’ E & 44o59’E) 6h 1.6h (2) West of Hawaii (170o03’ E & 34o58’E) 48min
zRMS for whole freq. January 31, 2000 Applying Fourier low-pass time filter to extract IG wave energy zRMS for higher (~IG) freq. Fourier low-pass filtered f<2 x 10⁻⁴ Hz (T>1.38h)
Ratio of zRMS : zRMS for IG freq. zRMS for whole freq. • Forced IG long-waves are predominant over slower variations in deeper ocean • larger in the northern part because of storms • tends to be larger near ridges, canyons and island chains • fairly consistent with seismologists’ hypothesis
Summary • A 2D barotropic ROMS is modified by incorporating long-wave dynamics based on MRL04 for generation of infragravity wave in basin scale, • ECMWF/UCAR 2D wavenumber spectral data is utilized to evaluate the wave-averaged forcing term, • Long waves in the North Pacific are evidently exited as forced (far) infragravity waves. • Remaining questions are : • - peak frequency is slightly lower than IG freq. band. • - amplitudes of IG waves are small • inconsistent with bottom pressure spectra. Why? • - do free IG waves exist? (nearshore-generated?)
Dominant Frequency of the Model-produced z Why is dominant frequency lower than IG freq.? IG wave dispersion relation Long waves at T=100s have wave lengths of L < 10km A finer grid may be needed ~regional simulations
Validity of Spatial/Temporal Resolution of Wave Data Comparison of wave data: ECMWF vs. NDBC buoys #46001 Off Alaska #51028 Off Hawaii
ECMWF vs. NDBC buoys (off Alaska) significant wave height mean wave period principal wave direction magnitude of Stokes transport Julian day in 2000
Comparison of |Tst| PSD: ECMWF vs. NDBC buoys #46001 off Alaska #51028 off Hawaii Higher frequency (thus high wavenumber) components are not well resolved with less energy in the ECWMF data.
Primary surface wave field (magnitude of Stokes transport) inverse Fourier transform Fourier transform apply filter function
U= Comparison between vortex force & radiation stress formalisms c.f. Lane, Restrepo and McWilliams (2006, JFM) • Scale separation both in time and horizontal space • Substitute into momentum and continuity equations analogous to Reynolds equation analogous to Bernoulli equation
Radiation stress and vortex force formalisms are identical Radiation stress Vortex force Bernoulli head Not transparent Horizontal vortex force • Wave dynamics is non-linear, but weak compared to turbulence • Non-linearity enters only through the surface B.C. • Lowest order ~ radiation stress merely captures set-up effect IG wave equation using radiation stress
Incorporation of wave-averaged term into 2D ROMS + advection, Coriolis, linear bottom drag terms
Modified Orlanski’s Radiation Scheme for Open Boundaries (for 2D barotropic ROMS) c: phase speed of each variable (z, u, v) t: nudging coefficient [T-1] a: coefficient for pressure-gradient mass correction (n.d.)
Volume (or area) averaged PE, KE, z and wave energy potential energy kinetic energy surface elevation z wave energy