Download
1 / 6
60 likes | 127 Views
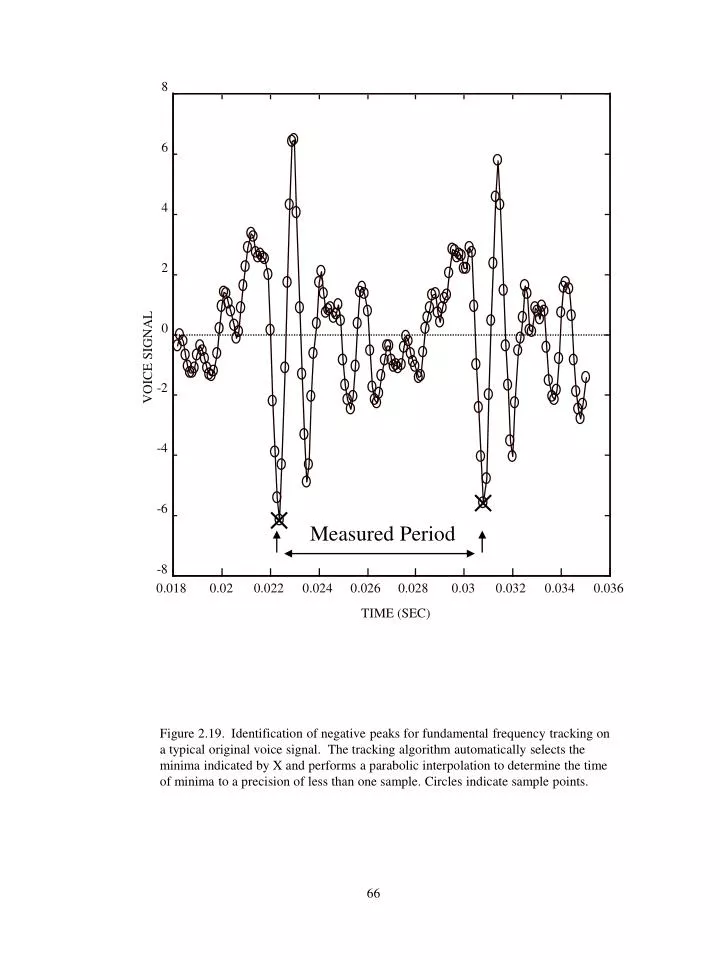
8. 6. 4. 2. 0. VOICE SIGNAL. -2. -4. -6. Measured Period. -8. 0.018. 0.02. 0.022. 0.024. 0.026. 0.028. 0.03. 0.032. 0.034. 0.036. TIME (SEC).

E N D
8 6 4 2 0 VOICE SIGNAL -2 -4 -6 Measured Period -8 0.018 0.02 0.022 0.024 0.026 0.028 0.03 0.032 0.034 0.036 TIME (SEC) Figure 2.19. Identification of negative peaks for fundamental frequency tracking on a typical original voice signal. The tracking algorithm automatically selects the minima indicated by X and performs a parabolic interpolation to determine the time of minima to a precision of less than one sample. Circles indicate sample points.
275 270 265 FREQ (HZ) 260 255 0 0.2 0.4 0.6 0.8 1 TIME (SEC) Figure 2.20. A high resolution 1 sec. fundamental frequency track resulting from subsample interpolation. Note lack of fundamental frequency quantization (flat spots) that would occur without interpolation.
275 270 FREQ (HZ) 265 260 0 0.2 0.4 0.6 0.8 1 TIME (SEC) 4 2 0 FREQ (HZ) -2 -4 0 0.2 0.4 0.6 0.8 1 TIME (SEC) Figure 2.21. The fundamental frequency track of Fig 2.20 is low pass filtered (top part A curve) and high pass filtered (bottom part B curve) yielding the tremor and HFPV time series respectively. A cutoff frequency of 10 Hz is selected.
45 40 35 30 25 #OCCURRANCES 20 15 10 5 0 -1.5 -1 -0.5 0 0.5 1 1.5 DELT FREQ (%) TOTSKIP=0 FCUT=10 TOTMAN=0 Figure 2.22. Histogram of frequency deviations of the high pass filtered fundamental frequency time series of Fig 2.20. Successful fundamental frequency tracking yields a Gaussian form distribution.
250 ORIGINAL FUNDAMENTAL FREQ. RESAMPLED FUNDAMENTAL FREQ. 240 230 FUNDAMENTAL FREQUENCY (HZ) 220 210 200 190 0 0.2 0.4 0.6 0.8 1 TIME (SEC) Figure 2.23. Fundamental frequency time series of original voice and voice re-sampled to remove tremor (low frequency variations). Most of the significant fundamental frequency variation is removed
266.6 266.4 FREQ (Hz) 266.2 0 0.2 0.4 0.6 0.8 1 TIME (SEC) 0.1 0.05 DELTA FREQ PERCENT 0 -0.05 -0.1 0 0.2 0.4 0.6 0.8 1 TIME (SEC) Figure 2.24. Fundamental frequency time series of voice re-sampled to remove all fundamental period variations: both HFPV and tremor. In the upper plot the residual variation after removal is shown in Hz; it is less than 0.4 Hz. In the lower plot the residual is shown in percent.