Download
1 / 57
570 likes | 724 Views
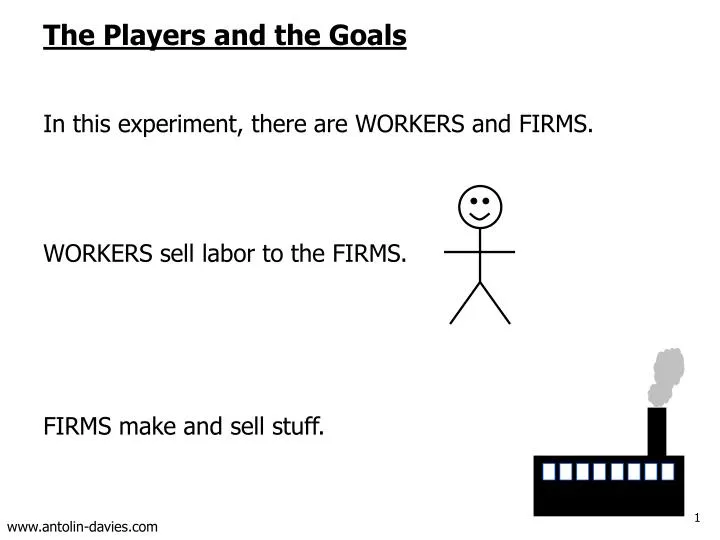
The Players and the Goals In this experiment, there are WORKERS and FIRMS. WORKERS sell labor to the FIRMS. FIRMS make and sell stuff. Blue workers Each worker’s goal: Maximize happiness. The Players and the Goals Two types of worker Red workers. One thing makes you happy: Money.

E N D
The Players and the Goals In this experiment, there are WORKERS and FIRMS. WORKERS sell labor to the FIRMS. FIRMS make and sell stuff.
Blue workers • Each worker’s goal: Maximize happiness • The Players and the Goals • Two types of worker • Red workers One thing makes you happy: Money
The Players and the Goals • One type of firm • Firms hire Red LaborandBlue Labor to produce their products. • Firms automatically sell everything they produce for $2 per unit. • Each firm’s goal: Maximize profit Profit = Ending $ – Starting $
The Objects = 1 hour of Blue labor Labor = 1 hour of Red labor Labor = 1 dollar $ = $5 dollars (each)
Labor Labor $ $ Labor Market Red workers and Blue workers sell as much labor as they can to firms for $.
Production and Goods Market Hired labor produces product. Product is automatically sold for $2 each. Red labor hired Blue labor hired Units of output produced
Example: Labor Market Blue worker 1 Sells 6 to Firm 7 for $5 each. Red worker 2 Sells 8 to Firm 7 for $5 each. $30 $40 How much product does Firm 7 produce?
Example: Labor Market Firm 7 manufactures 87 units of product. The product will be automatically sold for $2 per unit. 87
Example: Labor Market and Goods Market • Blue Worker 1 • Ends the experiment with (6)($5) = $30. Money = $30. • Red Worker 2 • Ends the experiment with (8)($5) = $40. Money = $40. • Firm 7 • spent $70 on labor, and • produced and sold 87 output at a price of $2 each. • Firm 7’s profit is $174 – $70 = $104.
Example: Cost/Benefit of Hiring More Labor Suppose you can hire 1 Red hour for $6 or 1 Blue hour for $7. So far, you have hired 1 Red hour and 3 Blue hours. 1. How much am I producing right now? 1 Red and 3 Blue 43 output 2. What happens if I hire 1 more Red worker? Output increases from 43 to 53 + 10 output 3. What does that do to my revenue? (10 output)($2) = + $20 revenue 4. What does it do to my costs? Cost of 1 Red worker = $6 + $6 cost 5. What does it do to my profit? + $20 revenue & + $6 cost + $14 profit
Example: Cost/Benefit of Hiring More Labor Suppose you can hire 1 Red hour for $6 or 1 Blue hour for $7. So far, you have hired 1 Red hour and 3 Blue hours. 6. What happens if I hire 1 more Blue worker? Output increases from 43 to 45 + 2 output 7. What does that do to my revenue? (2 output)($2) = + $4 revenue 8. What does it do to my costs? Cost of 1 Blue worker = $7 + $7 cost 9. What does it do to my profit? + $4 revenue & + $7 cost – $3 profit
Example: Cost/Benefit of Hiring More Labor Suppose you can hire 1 Red hour for $6 or 1 Blue hour for $7. So far, you have hired 1 Red hour and 3 Blue hours. Conclusion Hiring 1 more red hour increases profit by $14. Hiring 1 more blue hour decreases profit by $3 Hire 1 more red hour.
$5.00 $5.00 The Mechanics Firms Workers Buyer Manager
The Mechanics Firms Workers Manager Buyer
$5.50 $4.50 The Mechanics Firms Workers Buyer Manager
Labor Market Red workers sell your labor to firms for $. Blue workers sell your labor to firms for $. Firms: Every unit of output you produce is automatically sold for $2.
Report 1. Red workers report unsold labor and ending money. 2. Blue workers report unsold labor and ending money. 3. Firms report labor hired and ending money.
New Rules The wage rate that some workers receive is too low. In the interest of assuring a minimum standard of living, we now impose a minimum wage. LAW: Henceforth, no firm may pay less than per hour.
Labor Market Red workers sell your labor to firms for $. Blue workers sell your labor to firms for $. Firms: Every unit of output you produce is automatically sold for $2. FIRMS MUST PAY NO LESS THAN PER HOUR.
Report 1. Red workers report unsold labor and ending money. 2. Blue workers report unsold labor and ending money. 3. Firms report labor hired and ending money.
Price Controls The intent of price controls is to provide relief to buyers (e.g., college tuition caps, interest rate caps) or support to sellers (e.g., minimum wage, retail milk prices). • How do you cure a fever? • Prices are not levers that set value, they are metrics that respond to value. • Price controls fail on two counts: • legislating price does not legislate value, • legislating price prevents price from signaling value.
Prices Ration Goods All things are scarce. Scarce resources will be rationed. The question is, by what mechanism? Who will be excluded? • Cap on interest rates? • Rationed by risk. Higher risk borrowers excluded. • Cap on tuition? • Rationed by talent. Less talented students excluded. • Minimum wage? • Rationed by skill. Less skilled workers excluded.
Minimum Wage When we force an employer to pay a worker more than the job is worth, the job disappears. 40 years ago: Telephone operators 30 years ago: Gas station attendants 10 years ago: Fast food servers Last year: Pizza deliverers • What happens to workers whose jobs are eliminated? • Those whose labor is worth more than minimum wage? • Those whose labor is worth less than minimum wage?
Source: Statistical Abstract of the United States, and Bureau of Labor Statistics
Source: Statistical Abstract of the United States, and Bureau of Labor Statistics
Source: Statistical Abstract of the United States, and Bureau of Labor Statistics
Unemployment Population Ratio for 16-19 Year Olds as a Percentage of Ratio for 20-64 Year Olds Minimum Wage as Percentage of Average Hourly Wage Source: Bureau of Labor Statistics
How to Pay for a Minimum Wage • There are three ways in which a firm can find additional money to pay workers. • Layoff some workers and shift their wages to the remaining workers. • Keep all the workers and pay for the additional wages out of profits. • Keep all the workers and pay for the additional wages by raising prices.
Source: Bureau of Labor Statistics, California Department of Finance
But, we have to do something about the distribution of income. The rich are getting richer while the poor get poorer!
% of Households in Each Income Bracket (2006$) Source: Statistical Abstract of the United States, U.S. Bureau of the Census, 2009, Table 668.
% of Households in Each Income Bracket (2006$) From 1980 to 1990, the number of households with purchasing power of at least $75,000 grew while the number with purchasing power less than $75,000 declined. Source: Statistical Abstract of the United States, U.S. Bureau of the Census, 2009, Table 668.
% of Households in Each Income Bracket (2006$) From 1990 to 2006, the number of households with purchasing power of at least $75,000 grew while the number with purchasing power less than $75,000 declined. Source: Statistical Abstract of the United States, U.S. Bureau of the Census, 2009, Table 668.
The top 20% of households earned 44% of all income. • 2003 The top 20% of households earned 50% of all income. Source: Statistical Abstract of the United States, U.S. Bureau of the Census, 2008, Table 675.