Download
1 / 24
240 likes | 380 Views
The Scientific Method . What is Science?. A common misperception of many people is that science defines "truth". Science is not truth, but rather it is a way of thought. What is the Scientific Method?. It is a process by which experimentation is used to answer questions.

E N D
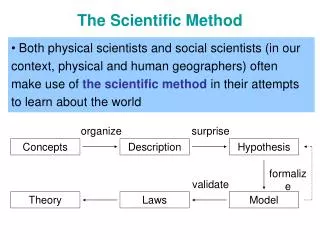
What is Science? A common misperception of many people is that science defines "truth". Science is not truth, but rather it is a way of thought.
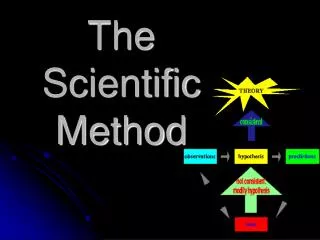
What is the Scientific Method? It is a process by which experimentation is used to answer questions. It is the way scientists investigate the world and produce knowledge about it.
(Observations)State the Problem • An observation is the act of gathering information. There are two types of observations: qualitative data and quantitative data.
A Hypothesis is • A tentative explanation for what has been observed • A prediction based on past observations • How something will occur in the future • "... a hypothesis is a statement whose truth is temporarily assumed, . ..." -- Albert Einstein
Experiments An experiment is a set of controlled observations that test the hypothesis. Scientists use an experiment to search for cause and effect relationships in nature. In other words, they design an experiment so that changes to one item cause something else to vary in a predictable way.
Experiments (Continued) • These changing quantities are called variables. An experiment must be planned carefully to test one variable at a time. • A variable is a quantity or condition that can have more than one value.
Data • Qualitative • Quantitative • Kinds of Variables • Graphs
Qualitative Data What qualitative observations can you make as view this cartoon? Information that describes color, odor, shape, or other physical characteristics. Anything that relates to the five senses
Quantitative Data Numerical data Measurements made using tools such as a balance, meter stick, graduated cylinder, stop watch.
Kinds of Variables An experiment usually has three kinds of variables: • dependent (D.R.Y.) Dependent Responding y-axis • independent (M.I.X.) Manipulated Independent x-axis • controlled (unchanged)
The variable that the experimenter decides to change Only one independent variable in an experiment Also known as the manipulated variable Independent Variable
Dependent Variable • Its value changes in response to a change in the independent variable • The value of the dependent variable is caused by and depends on the value of the independent variable • Also known as the responding variable
Controlled Variables (Constants) • Controlled variables are quantities that a scientist wants to remain constant. • They must be observed as carefully as the dependent variables. • Most experiments have more than one controlled variable. • Controlled variables provide a standard for comparison
Analysis • An experiment may generate a large amount of data. This data must be carefully analyzed. • A goal of many experiments is to determine if a pattern exists. • Creating a graph helps to reveal a pattern if one exists.
Types of Graphs Circle Graph Bar Graph Line Graph
Words that help describe Graphs • Direct relationship – Both IV & DV increase (ex: solubility of solids) • Indirect relationship – IV increase & DV decreases (ex: solubility of gases) • Interpolate – Predict (guess) a point that is between 2 points on a graph • Extrapolate – Predict a point beyond where the graph stops
Solubility Graph Extrapolate Interpolate Solid IV & DV increase Gas IV increases & DV decreases
Conclusions • A conclusion is a judgment based on the information obtained in your experiment. • Your conclusions should summarize how your results support or contradict your hypothesis.
Theory • A theory is an explanation that has been supported by numerous experiments. • Theories can be modified based on new experimental data. Examples of theories include the theory of relativity and the quantum theory. • Theories can be tweaked, but they are seldom, if ever, entirely replaced.
Scientific Law • The biggest difference between a law and a theory is that a theory is much more complex and dynamic. • A law governs a single action, whereas a theory explains a whole series of related phenomena. • Some scientific laws, or laws of nature, include the law of gravity, the law of thermodynamics, and Law of Conservation of Matter.