Download
1 / 1
10 likes | 114 Views
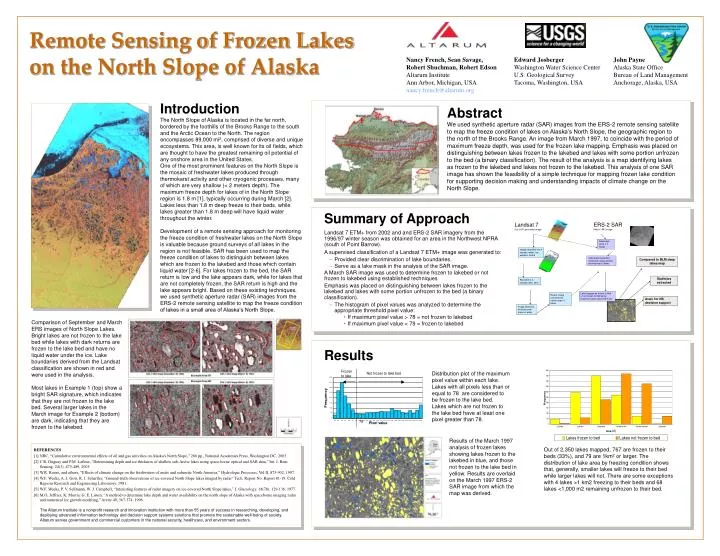
Nancy French, Sean Savage, Robert Shuchman, Robert Edson Altarum Institute Ann Arbor, Michigan, USA nancy.french@altarum.org. Edward Josberger Washington Water Science Center U.S. Geological Survey Tacoma, Washington, USA. John Payne Alaska State Office Bureau of Land Management

E N D
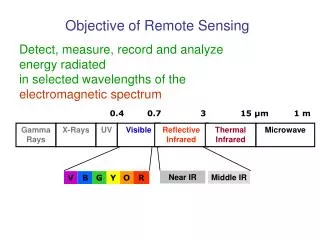
Nancy French, Sean Savage, Robert Shuchman, Robert Edson Altarum Institute Ann Arbor, Michigan, USA nancy.french@altarum.org Edward Josberger Washington Water Science Center U.S. Geological Survey Tacoma, Washington, USA John Payne Alaska State Office Bureau of Land Management Anchorage, Alaska, USA Abstract We used synthetic aperture radar (SAR) images from the ERS-2 remote sensing satellite to map the freeze condition of lakes on Alaska’s North Slope, the geographic region to the north of the Brooks Range. An image from March 1997, to coincide with the period of maximum freeze depth, was used for the frozen lake mapping. Emphasis was placed on distinguishing between lakes frozen to the lakebed and lakes with some portion unfrozen to the bed (a binary classification). The result of the analysis is a map identifying lakes as frozen to the lakebed and lakes not frozen to the lakebed. This analysis of one SAR image has shown the feasibility of a simple technique for mapping frozen lake condition for supporting decision making and understanding impacts of climate change on the North Slope. Landsat 7 July 2001 geocoded image ERS-2 SARMarch 1997 image Geocoded using L-7 image Image classified into 4 classes: water, ice, wetland, tundra Lake areas extracted (masked) using Landsat-derived map of lakes Compared to BLM deep lakes map Statistics extracted Recoded to 2 classes: lake, land Lakes tagged as frozen to bed or not frozen to bed using maximum pixel value threshold Raster image converted to vector map of lakes Summary of Approach Landsat 7 ETM+ from 2002 and and ERS-2 SAR imagery from the 1996/97 winter season was obtained for an area in the Northwest NPRA (south of Point Barrow). A supervised classification of a Landsat 7 ETM+ image was generated to: • Provided clear discrimination of lake boundaries. • Serve as a lake mask in the analysis of the SAR image. A March SAR image was used to determine frozen to lakebed or not frozen to lakebed using established techniques Emphasis was placed on distinguishing between lakes frozen to the lakebed and lakes with some portion unfrozen to the bed (a binary classification). • The histogram of pixel values was analyzed to determine the appropriate threshold pixel value: • If maximum pixel value > 78 = not frozen to lakebed • If maximum pixel value < 79 = frozen to lakebed Avail. for NS decision support Image filtered to exclude small areas of water Remote Sensing of Frozen Lakes on the North Slope of Alaska Introduction The North Slope of Alaska is located in the far north, bordered by the foothills of the Brooks Range to the south and the Arctic Ocean to the North. The region encompasses 89,000 mi2, comprised of diverse and unique ecosystems. This area, is well known for its oil fields, which are thought to have the greatest remaining oil potential of any onshore area in the United States. One of the most prominent features on the North Slope is the mosaic of freshwater lakes produced through thermokarst activity and other cryogenic processes, many of which are very shallow (< 2 meters depth). The maximum freeze depth for lakes of in the North Slope region is 1.8 m [1], typically occurring during March [2]. Lakes less than 1.8 m deep freeze to their beds, while lakes greater than 1.8 m deep will have liquid water throughout the winter. Development of a remote sensing approach for monitoring the freeze condition of freshwater lakes on the North Slope is valuable because ground surveys of all lakes in the region is not feasible. SAR has been used to map the freeze condition of lakes to distinguish between lakes which are frozen to the lakebed and those which contain liquid water [2-6]. For lakes frozen to the bed, the SAR return is low and the lake appears dark, while for lakes that are not completely frozen, the SAR return is high and the lake appears bright. Based on these existing techniques, we used synthetic aperture radar (SAR) images from the ERS-2 remote sensing satellite to map the freeze condition of lakes in a small area of Alaska’s North Slope. Comparison of September and March ERS images of North Slope Lakes. Bright lakes are not frozen to the lake bed while lakes with dark returns are frozen to the lake bed and have no liquid water under the ice. Lake boundaries derived from the Landsat classification are shown in red and were used in the analysis. Most lakes in Example 1 (top) show a bright SAR signature, which indicates that they are not frozen to the lake bed. Several larger lakes in the March image for Example 2 (bottom) are dark, indicating that they are frozen to the lakebed. Results Distribution plot of the maximum pixel value within each lake. Lakes with all pixels less than or equal to 78 are considered to be frozen to the lake bed. Lakes which are not frozen to the lake bed have at least one pixel greater than 78. Results of the March 1997 analysis of frozen lakes showing lakes frozen to the lakebed in blue, and those not frozen to the lake bed in yellow. Results are overlaid on the March 1997 ERS-2 SAR image from which the map was derived. Out of 2,350 lakes mapped, 767 are frozen to their beds (33%), and 79 are 1km2 or larger. The distribution of lake area by freezing condition shows that, generally, smaller lakes will freeze to their bed while larger lakes will not. There are some exceptions with 4 lakes >1 km2 freezing to their beds and 68 lakes <1,000 m2 remaining unfrozen to their bed. REFERENCES [1] NRC, “Cumulative environmental effects of oil and gas activities on Alaska's North Slope,” 288 pp., National Academies Press, Washington DC, 2003. [2] C.R. Duguay and P.M. Lafleur, “Determining depth and ice thickness of shallow sub-Arctic lakes using space-borne optical and SAR data,” Int. J. Rem. Sensing, 24(3), 475-489, 2003. [3] W.R. Rouse, and others, “Effects of climate change on the freshwaters of arctic and subarctic North America,” Hydrologic Processes, Vol II, 873-902, 1997. [4] W.F. Weeks, A. J. Gow, R. J. Schertler, “Ground-truth observations of ice-covered North Slope lakes imaged by radar” Tech. Report No. Report 81-19, Cold Regions Research and Engineering Laboratory, 1981. [5] W.F. Weeks, P. V. Sellmann, W. J. Campbell, “Interesting features of radar imagery on ice-covered North Slope lakes,” J. Glaciology, 18(78), 129-136, 1977. [6] M.O. Jeffries, K. Morris, G. E. Liston, “A method to determine lake depth and water availability on the north slope of Alaska with spaceborne imaging radar and numerical ice growth modeling,” Arctic 49, 367-374, 1996. The Altarum Institute is a nonprofit research and innovation institution with more than 55 years of success in researching, developing, and deploying advanced information technology and decision support systems solutions that promote the sustainable well-being of society. Altarum serves government and commercial customers in the national security, healthcare, and environment sectors.