Download
1 / 37
370 likes | 468 Views
Texas: Demographic Characteristics and Trends. State Farm Insurance August 23, 2011 Austin, TX. Growing States, 2000-2010. 15.7% of numerical change in U.S. . Source: U.S. Census Bureau. 2000 and 2010 Census Counts . . Total Population and Change by County, 2010. Population % Change,

E N D
Texas: Demographic Characteristics and Trends State Farm Insurance August 23, 2011 Austin, TX
Growing States, 2000-2010 15.7% of numerical change in U.S. Source: U.S. Census Bureau. 2000 and 2010 Census Counts.
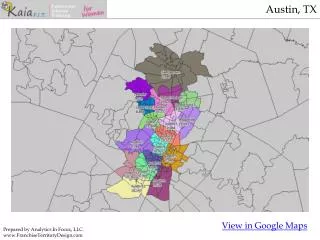
Total Population and Change by County, 2010 Population % Change, 2000 to 2010 Total Population Source: U.S. Census Bureau. 2000 and 2010 Census Counts. Mapsproduced by the Texas State Data Center.
Total Population and Components of Population Change in Texas, 1950-2009
Estimated Annual Net Migration to Texas, 2000-2009 Source: U.S. Census Bureau. 2009 Population Estimates.
States with Largest Estimated Unauthorized Immigrant Populations, 2010 Source: Pew Hispanic Center estimates based on residual methodology applied to March Supplements to the Current Population Survey (February 1, 2011).
Texas Racial and Ethnic Composition, • 2000 and 2010 Source: U.S. Census Bureau. 2000 and 2010 Census Counts.
Population by County, 2010 Non-Hispanic White Hispanic Source: U.S. Census Bureau. 2000 and 2010 Census Counts. Mapsproduced by the Texas State Data Center.
Population by County, 2010 Non-Hispanic Black Non-Hispanic Asian Source: U.S. Census Bureau. 2000 and 2010 Census Counts. Mapsproduced by the Texas State Data Center.
Change in Population by County, 2000-2010 Non-Hispanic White Hispanic Source: U.S. Census Bureau. 2000 and 2010 Census Counts. Mapsproduced by the Texas State Data Center.
Change in Population by County, 2000-2010 Non-Hispanic Asian Non-Hispanic Black Source: U.S. Census Bureau. 2000 and 2010 Census Counts. Mapsproduced by the Texas State Data Center.
Projected Racial and Ethnic Population Percentages for Texas, 2000-2040 Source: Texas State Data Center. 2008 Population Projections, 2000-2007 Migration Scenario.
Projected Texas Population Pyramids by Race and Ethnicity, 2010 Source: Texas State Data Center. 2009 Population Projections.
Population Aged 65 Years and Older by County, 2009 Estimated Percent 65 Years and Older Population 65 Years and Older Source: Texas State Data Center. 2009 Population Estimates. Mapsproduced by the Texas State Data Center.
Percent of Persons Aged 65 Years and Older by County, 2000 Census and 2040 Projected 2000 Count 2040 Projection <11.9 12.0 – 14.9 15.0 – 19.9 20.0 or more Source: U.S. Census Bureau. 2000 Census Count.Texas State Data Center. 2009 Population Projections. Mapsproduced by the Texas State Data Center.
Projected Population Among Older Texans Source: Texas State Data Center. 2008 Population Projections, 2000-2004 Migration Scenario.
Projection of Ethnicity of Texas PopulationAged 65 Years and Older, 2000 to 2040 Source: Texas State Data Center. 2008 Population Projections, 2000-2004 Migration Scenario.
Educational Attainment of Persons 25 Years of Age and Older by Ethnicityfor Texas, 2009 Source: U.S. Census Bureau. American Community Survey, 2009.
Percent of People 25 Years and Over Who Have Completed High School (includes equivalency)by Rural and Non-Metro Areas and County, 2005-2009 Source: U.S. Census Bureau. American Community Survey, 5-Year Sample 2005-2009. Mapproduced by the Texas State Data Center.
Percent of People 25 Years and Over Who Have Completed a Bachelor’s Degree by Rural and Non-Metro Areas and County, 2005-2009 Source: U.S. Census Bureau. American Community Survey, 5-Year Sample 2005-2009. Mapproduced by the Texas State Data Center.
Unemployment Rates, 2000 to July, 2011 Source: Bureau of Labor Statistics. Federal Reserve Bank of Dallas.
Median Household Income by County, 2005-2009 Source: U.S. Census Bureau. American Community Survey, 5-Year Sample 2005-2009. Mapproduced by the Texas State Data Center.
Projected Percent of Labor Force by Educational Attainment in Texas, 2000 and 2040 Source: Texas State Data Center. 2009 Population Projections.
Percent of People Below Poverty in the Past 12 Months (for whom poverty status is determined) by Metro and Non-Metro Area and County, 2005-2009 Source: U.S. Census Bureau. American Community Survey, 5-Year Sample 2005-2009. Mapproduced by the Texas State Data Center.
Percent of Texans Reporting a Self-Care Limitation or Any Limitation by Age, 2007 Source: Texas State Data Center tabulation of U.S. Bureau of the Census American Community Survey, 2007.
Projected Growth of the 65 Year Old and Over Population Reporting a Self-Care Limitation for Texas, 2000-2040(Assuming Constant Age/Sex/Race/Ethnic Rates of Disability) Source: Office of the State Demographer. 2000-2004 Projection Scenario.
Physicians per 1,000 Population Aged 65 Years and Older by County, 2008 Source: U.S. Census Bureau. 2009 Population Estimates. Texas Medical Board. Mapproduced by the Texas State Data Center.
Physicians per 1,000 Population, 2010 Physician Rate Change, 2000-2010 Physician Rate Source: U.S. Census Bureau. 2000 and 2010 Census Counts. Texas Medical Board. Mapsproduced by the Texas State Data Center.
Physicians per 100,000 by • Metro & Border Status of Counties, 2009 Sources: U.S. Census Bureau. 2009 Estimates.Department of State Health Services. Health Professions Resource Center Database.
Projected Increase of Obesity in Texas by Ethnicity, 2006-2040 Source: Texas State Data Center. Population Projections, 2000-2004 Migration Scenario.
Projected Number of Adults with Diabetes by Race and Ethnicity for Texas, 2010-2040 Projected Persons with Diabetes Source: Office of the State Demographer. 2006 Population Projections, 2000-2004 Migration Scenario.
Percent Health Insurance Coverage by Race and Ethnicity and Type of Insurance, 2008 Source: American Community Survey. 2008 Microdata.
Percent of People Lacking Health Insurance Coverage by Metro and Non-Metro Area, 2009 The Census Bureau estimates that in 2009 Texas had the highest uninsured rate in the country, at 26.1%, or 6.4 million people. Texas also had the highest uninsured rate of children, with 17.4%, or 1.28 million children lacking insurance. Source: U.S. Census Bureau. 2009 American Community Survey . Map produced by the Texas State Data Center.
Demographics & Destiny Texas is growing, and growing fast. Texas is young, but aging. Texas is becoming more diverse. Racial/ethnic disparities remain in many areas important to the future of Texas.
Contact Office: (512) 463-8390 or (210) 458-6530 E-mail: State.Demographer@osd.state.tx.us Website: http://osd.state.tx.us Office of the State Demographer