Download
1 / 52
520 likes | 622 Views
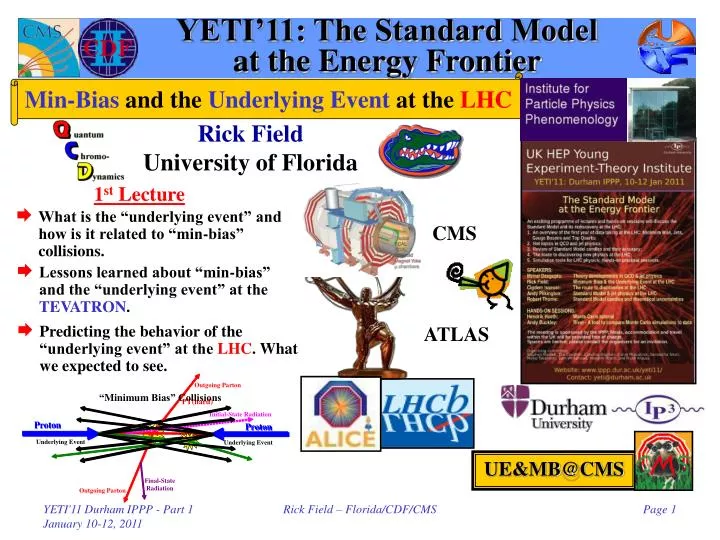
YETI’11: The Standard Model at the Energy Frontier. Min-Bias and the Underlying Event at the LHC. Rick Field University of Florida. 1 st Lecture. What is the “underlying event” and how is it related to “min-bias” collisions. CMS.

E N D
YETI’11: The Standard Model at the Energy Frontier Min-Bias and the Underlying Event at the LHC Rick Field University of Florida 1st Lecture • What is the “underlying event” and how is it related to “min-bias” collisions. CMS • Lessons learned about “min-bias” and the “underlying event” at the TEVATRON. ATLAS • Predicting the behavior of the “underlying event” at the LHC. What we expected to see. UE&MB@CMS Rick Field – Florida/CDF/CMS
“Hard Scattering” Component QCD Monte-Carlo Models:High Transverse Momentum Jets • Start with the perturbative 2-to-2 (or sometimes 2-to-3) parton-parton scattering and add initial and final-state gluon radiation (in the leading log approximation or modified leading log approximation). “Underlying Event” • The “underlying event” consists of the “beam-beam remnants” and from particles arising from soft or semi-soft multiple parton interactions (MPI). The “underlying event” is an unavoidable background to most collider observables and having good understand of it leads to more precise collider measurements! • Of course the outgoing colored partons fragment into hadron “jet” and inevitably “underlying event” observables receive contributions from initial and final-state radiation. Rick Field – Florida/CDF/CMS
“Hard Scattering” Component QCD Monte-Carlo Models:Lepton-Pair Production • Start with the perturbative Drell-Yan muon pair production and add initial-state gluon radiation (in the leading log approximation or modified leading log approximation). “Underlying Event” • The “underlying event” consists of the “beam-beam remnants” and from particles arising from soft or semi-soft multiple parton interactions (MPI). • Of course the outgoing colored partons fragment into hadron “jet” and inevitably “underlying event” observables receive contributions from initial-state radiation. Rick Field – Florida/CDF/CMS
Proton Proton Proton Proton MPI, Pile-Up, and Overlap MPI: Multiple Parton Interactions • MPI: Additional 2-to-2 parton-parton scatterings within a single hadron-hadron collision. Pile-Up Interaction Region Dz • Pile-Up: More than one hadron-hadron collision in the beam crossing. Overlap • Overlap: An experimental timing issue where a hadron-hadron collision from the next beam crossing gets included in the hadron-hadron collision from the current beam crossing because the next crossing happened before the event could be read out. Rick Field – Florida/CDF/CMS
Proton-Proton Collisions stot = sEL + sSD+sDD+sHC stot = sEL + sIN ND “Inelastic Non-Diffractive Component” The “hard core” component contains both “hard” and “soft” collisions. Rick Field – Florida/CDF/CMS
The Inelastic Non-Diffractive Cross-Section Occasionally one of the parton-parton collisions is hard (pT > ≈2 GeV/c) Majority of “min-bias” events! “Semi-hard” parton-parton collision (pT < ≈2 GeV/c) + + + + … Multiple-parton interactions (MPI)! Rick Field – Florida/CDF/CMS
The “Underlying Event” Select inelastic non-diffractive events that contain a hard scattering 1/(pT)4→ 1/(pT2+pT02)2 Hard parton-parton collisions is hard (pT > ≈2 GeV/c) “Semi-hard” parton-parton collision (pT < ≈2 GeV/c) The “underlying-event” (UE)! + + + … Given that you have one hard scattering it is more probable to have MPI! Hence, the UE has more activity than “min-bias”. Multiple-parton interactions (MPI)! Rick Field – Florida/CDF/CMS
Model of sND Allow leading hard scattering to go to zero pT with same cut-off as the MPI! “Semi-hard” parton-parton collision (pT < ≈2 GeV/c) 1/(pT)4→ 1/(pT2+pT02)2 Model of the inelastic non-diffractive cross section! + + + + … Multiple-parton interactions (MPI)! Rick Field – Florida/CDF/CMS
UE Tunes Allow primary hard-scattering to go to pT = 0 with same cut-off! “Underlying Event” All of Rick’s tunes (except X2): A, AW, AWT,DW, DWT, D6, D6T, CW, X1, and Tune Z1, are UE tunes! Fit the “underlying event” in a hard scattering process. 1/(pT)4→ 1/(pT2+pT02)2 “Min-Bias” (ND) “Min-Bias” (add single & double diffraction) + + + Predict MB (ND)! + … Predict MB (IN)! Rick Field – Florida/CDF/CMS
MB Tunes “Underlying Event” Most of Peter Skand’s tunes: S320 Perugia 0, S325 Perugia X, S326 Perugia 6 are MB tunes! Predict the “underlying event” in a hard scattering process! “Min-Bias” (ND) + + + Fit MB (ND). + … Rick Field – Florida/CDF/CMS
MB+UE Tunes “Underlying Event” Most of Hendrik’s “Professor” tunes: ProQ20, P329 are MB+UE! Fit the “underlying event” in a hard scattering process! “Min-Bias” (ND) Simultaneous fit to both MB & UE + + + The ATLAS AMBT1 Tune is an MB+UE tune, but because they include in the fit the ATLAS UE data with PTmax > 10 GeV/c (big errors) the LHC UE data does not have much pull (hence mostly an MB tune!). Fit MB (ND). + … Rick Field – Florida/CDF/CMS
Traditional Approach CDF Run 1 Analysis • Look at charged particle correlations in the azimuthal angle Df relative to a leading object (i.e. CaloJet#1, ChgJet#1, PTmax, Z-boson). For CDF PTmin = 0.5 GeV/c hcut = 1. Charged Particle Df Correlations PT > PTmin |h| < hcut Leading Calorimeter Jet or Leading Charged Particle Jet or Leading Charged Particle or Z-Boson “Transverse” region very sensitive to the “underlying event”! • Define |Df| < 60o as “Toward”, 60o < |Df| < 120o as “Transverse”, and |Df| > 120o as “Away”. • All three regions have the same area in h-f space, Dh×Df = 2hcut×120o = 2hcut×2p/3. Construct densities by dividing by the area in h-f space. Rick Field – Florida/CDF/CMS
ISAJET 7.32 (without MPI)“Transverse” Density ISAJET uses a naïve leading-log parton shower-model which does not agree with the data! • Plot shows average “transverse” charge particle density (|h|<1, pT>0.5 GeV) versus PT(charged jet#1) compared to the QCD hard scattering predictions of ISAJET 7.32 (default parameters with PT(hard)>3 GeV/c) . • The predictions of ISAJET are divided into two categories: charged particles that arise from the break-up of the beam and target (beam-beam remnants); and charged particles that arise from the outgoing jet plus initial and final-state radiation(hard scattering component). ISAJET “Hard” Component Beam-Beam Remnants Rick Field – Florida/CDF/CMS
HERWIG 6.4 (without MPI)“Transverse” Density • Plot shows average “transverse” charge particle density (|h|<1, pT>0.5 GeV) versus PT(charged jet#1) compared to the QCD hard scattering predictions of HERWIG 5.9(default parameters with PT(hard)>3 GeV/c without MPI). • The predictions of HERWIG are divided into two categories: charged particles that arise from the break-up of the beam and target (beam-beam remnants); and charged particles that arise from the outgoing jet plus initial and final-state radiation(hard scattering component). HERWIG uses a modified leading-log parton shower-model which does agrees better with the data! HERWIG “Hard” Component Beam-Beam Remnants Rick Field – Florida/CDF/CMS
HERWIG 6.4 (without MPI)“Transverse” PT Distribution • Compares the average “transverse” charge particle density (|h|<1, pT>0.5 GeV) versus PT(charged jet#1) and the pT distribution of the “transverse” density, dNchg/dhdfdPT with the QCD hard scattering predictions of HERWIG 6.4(default parameters with PT(hard)>3 GeV/c without MPI). Shows how the “transverse” charge particle density is distributed in pT. HERWIG has the too steep of a pT dependence of the “beam-beam remnant” component of the “underlying event”! Herwig PT(chgjet#1) > 30 GeV/c “Transverse” <dNchg/dhdf> = 0.51 Herwig PT(chgjet#1) > 5 GeV/c <dNchg/dhdf> = 0.40 Rick Field – Florida/CDF/CMS
MPI: Multiple PartonInteractions • PYTHIA models the “soft” component of the underlying event with color string fragmentation, but in addition includes a contribution arising from multiple parton interactions (MPI) in which one interaction is hard and the other is “semi-hard”. • The probability that a hard scattering events also contains a semi-hard multiple parton interaction can be varied but adjusting the cut-off for the MPI. • One can also adjust whether the probability of a MPI depends on the PT of the hard scattering, PT(hard) (constant cross section or varying with impact parameter). • One can adjust the color connections and flavor of the MPI (singlet or nearest neighbor, q-qbar or glue-glue). • Also, one can adjust how the probability of a MPI depends on PT(hard) (single or double Gaussian matter distribution). Rick Field – Florida/CDF/CMS
Tuning PYTHIA 6.2:Multiple Parton Interaction Parameters Hard Core Determines the energy dependence of the MPI! Determine by comparing with 630 GeV data! Affects the amount of initial-state radiation! Take E0 = 1.8 TeV Reference point at 1.8 TeV Rick Field – Florida/CDF/CMS
PYTHIA 6.206 Defaults MPI constant probability scattering • Plot shows the “Transverse” charged particle density versus PT(chgjet#1) compared to the QCD hard scattering predictions of PYTHIA 6.206 (PT(hard) > 0) using the default parameters for multiple parton interactions and CTEQ3L, CTEQ4L, and CTEQ5L. PYTHIA default parameters Default parameters give very poor description of the “underlying event”! Note Change PARP(67) = 4.0 (< 6.138) PARP(67) = 1.0 (> 6.138) Rick Field – Florida/CDF/CMS
Run 1 PYTHIA Tune A CDF Default! • Plot shows the “transverse” charged particle density versus PT(chgjet#1) compared to the QCD hard scattering predictions of two tuned versions of PYTHIA 6.206 (CTEQ5L, Set B (PARP(67)=1)andSet A(PARP(67)=4)). PYTHIA 6.206 CTEQ5L Run 1 Analysis Old PYTHIA default (more initial-state radiation) Old PYTHIA default (more initial-state radiation) New PYTHIA default (less initial-state radiation) New PYTHIA default (less initial-state radiation) Rick Field – Florida/CDF/CMS
“Transverse” Conesvs “Transverse” Regions • Sum the PT of charged particles in two cones of radius 0.7 at the same h as the leading jet but with |DF| = 90o. • Plot the cone with the maximum and minimum PTsum versus the ET of the leading (calorimeter) jet. “Cone Analysis” (Tano, Kovacs, Huston, Bhatti) Transverse Cone: p(0.7)2=0.49p Transverse Region: 2p/3=0.67p Rick Field – Florida/CDF/CMS
Energy Dependenceof the “Underlying Event” “Cone Analysis” (Tano, Kovacs, Huston, Bhatti) • Sum the PT of charged particles (pT > 0.4 GeV/c) in two cones of radius 0.7 at the same h as the leading jet but with |DF| = 90o. Plot the cone with the maximum and minimum PTsum versus the ET of the leading (calorimeter) jet. • Note that PYTHIA 6.115 is tuned at 630 GeV with PT0 = 1.4 GeV and at 1,800 GeV with PT0 = 2.0 GeV. This implies that e = PARP(90) should be around 0.30 instead of the 0.16 (default). • For the MIN cone 0.25 GeV/c in radius R = 0.7 implies a PTsum density of dPTsum/dhdf = 0.16 GeV/c and 1.4 GeV/c in the MAX cone implies dPTsum/dhdf = 0.91 GeV/c (average PTsum density of 0.54 GeV/c per unit h-f). 630 GeV 1,800 GeV PYTHIA 6.115 PT0 = 1.4 GeV PYTHIA 6.115 PT0 = 2.0 GeV Rick Field – Florida/CDF/CMS
“Transverse” Charged DensitiesEnergy Dependence Increasing e produces less energy dependence for the UE resulting in less UE activity at the LHC! Lowering PT0 at 630 GeV (i.e. increasing e) increases UE activity resulting in less energy dependence. • Shows the “transverse” charged PTsum density (|h|<1, PT>0.4 GeV) versus PT(charged jet#1) at 630 GeV predicted by HERWIG 6.4 (PT(hard) > 3 GeV/c, CTEQ5L) and a tuned version of PYTHIA 6.206 (PT(hard) > 0, CTEQ5L, Set A, e = 0, e = 0.16 (default) and e = 0.25 (preferred)). • Also shown are the PTsum densities (0.16 GeV/c and 0.54 GeV/c) determined from the Tano, Kovacs, Huston, and Bhatti “transverse” cone analysis at 630 GeV. Rick Field Fermilab MC Workshop October 4, 2002! Reference point E0 = 1.8 TeV Rick Field – Florida/CDF/CMS
Run 1 vs Run 2: “Transverse” Charged Particle Density “Transverse” region as defined by the leading “charged particle jet” • Shows the data on the average “transverse” charge particle density (|h|<1, pT>0.5 GeV) as a function of the transverse momentum of the leading charged particle jet from Run 1. Excellent agreement between Run 1 and 2! • Compares the Run 2 data (Min-Bias, JET20, JET50, JET70, JET100) with Run 1. The errors on the (uncorrected) Run 2 data include both statistical and correlated systematic uncertainties. PYTHIA Tune A was tuned to fit the “underlying event” in Run I! • Shows the prediction of PYTHIA Tune A at 1.96 TeV after detector simulation (i.e. after CDFSIM). Rick Field – Florida/CDF/CMS
Run 1 vs Run 2: “Transverse” Charged PTsum Density “Transverse” region as defined by the leading “charged particle jet” • Shows the data on the average “transverse” charged PTsum density (|h|<1, pT>0.5 GeV) as a function of the transverse momentum of the leading charged particle jet from Run 1. Excellent agreement between Run 1 and 2! • Compares the Run 2 data (Min-Bias, JET20, JET50, JET70, JET100) with Run 1. The errors on the (uncorrected) Run 2 data include both statistical and correlated systematic uncertainties. PYTHIA Tune A was tuned to fit the “underlying event” in Run I! • Shows the prediction of PYTHIA Tune A at 1.96 TeV after detector simulation (i.e. after CDFSIM). Rick Field – Florida/CDF/CMS
“Underlying Event”as defined by “Calorimeter Jets” • Look at charged particle correlations in the azimuthal angle Df relative to the leading JetClu jet. • Define |Df| < 60o as “Toward”, 60o < |Df| < 120o as “Transverse”, and |Df| > 120o as “Away”. • All three regions have the same size in h-f space, DhxDf = 2x120o = 4p/3. Charged Particle Df Correlations pT > 0.5 GeV/c |h| < 1 Look at the charged particle density in the “transverse” region! “Transverse” region is very sensitive to the “underlying event”! Perpendicular to the plane of the 2-to-2 hard scattering Away-side “jet” (sometimes) Rick Field – Florida/CDF/CMS
“Transverse” Charged Particle Density • Shows the data on the average “transverse” charge particle density (|h|<1, PT>0.5 GeV) as a function of the transverse energy of the leading JetClu jet (R = 0.7, |h(jet)| < 2) from Run 2. “Transverse” region as defined by the leading “calorimeter jet” , compared with PYTHIA Tune A after CDFSIM. • Compares the “transverse” region of the leading “charged particle jet”, chgjet#1, with the “transverse” region of the leading “calorimeter jet” (JetClu R = 0.7), jet#1. Rick Field – Florida/CDF/CMS
“Transverse” Charged PTsum Density • Shows the data on the average “transverse” charged PTsum density (|h|<1, PT>0.5 GeV) as a function of the transverse energy of the leading JetClu jet (R = 0.7, |h(jet)| < 2) from Run 2. “Transverse” region as defined by the leading “calorimeter jet” , compared with PYTHIA Tune A after CDFSIM. • Compares the “transverse” region of the leading “charged particle jet”, chgjet#1, with the “transverse” region of the leading “calorimeter jet” (JetClu R = 0.7), jet#1. Rick Field – Florida/CDF/CMS
Rick Field University of ChicagoJuly 11, 2006 “Back-to-Back” “Leading Jet” • Shows the data on the tower ETsum density, dETsum/dhdf, in the “transMAX” and “transMIN” region (ET > 100 MeV, |h| < 1) versus PT(jet#1) for “Leading Jet” and “Back-to-Back” events. • Compares the (corrected) data with PYTHIA Tune A (with MPI) and HERWIG (without MPI) at the particle level (all particles, |h| < 1). Rick Field – Florida/CDF/CMS
Rick Field University of ChicagoJuly 11, 2006 “Back-to-Back” “Leading Jet” Neither PY Tune A or HERWIG fits the ETsum density in the “transferse” region! HERWIG does slightly better than Tune A! • Shows the data on the tower ETsum density, dETsum/dhdf, in the “transMAX” and “transMIN” region (ET > 100 MeV, |h| < 1) versus PT(jet#1) for “Leading Jet” and “Back-to-Back” events. • Compares the (corrected) data with PYTHIA Tune A (with MPI) and HERWIG (without MPI) at the particle level (all particles, |h| < 1). Rick Field – Florida/CDF/CMS
Rick Field University of ChicagoJuly 11, 2006 “Leading Jet” “Back-to-Back” “transDIF” is more sensitive to the “hard scattering” component of the “underlying event”! • Use the leading jet to define the MAX and MIN “transverse” regions on an event-by-event basis with MAX (MIN) having the largest (smallest) charged PTsum density. • Shows the “transDIF” = MAX-MIN ETsum density, dETsum/dhdf, for all particles (|h| < 1) versus PT(jet#1) for “Leading Jet” and “Back-to-Back” events. Rick Field – Florida/CDF/CMS
Rick Field University of ChicagoJuly 11, 2006 Possible Scenario?? • PYTHIA Tune A fits the charged particle PTsum density for pT > 0.5 GeV/c, but it does not produce enough ETsum for towers with ET > 0.1 GeV. • It is possible that there is a sharp rise in the number of particles in the “underlying event” at low pT (i.e. pT < 0.5 GeV/c). • Perhaps there are two components, a vary “soft” beam-beam remnant component (Gaussian or exponential) and a “hard” multiple interaction component. Rick Field – Florida/CDF/CMS
Charged Particle Multiplicity • Data at 1.96 TeV on the charged particle multiplicity (pT > 0.4 GeV/c, |h| < 1) for “min-bias” collisions at CDF Run 2 (non-diffractive cross-section). Tune A! No MPI! • The data are compared with PYTHIA Tune A and Tune A without multiple parton interactions (pyAnoMPI). Rick Field – Florida/CDF/CMS
PYTHIA Tune A Min-Bias“Soft” + ”Hard” New Ten decades! 12% of “Min-Bias” events have PT(hard) > 5 GeV/c! 1% of “Min-Bias” events have PT(hard) > 10 GeV/c! Lots of “hard” scattering in “Min-Bias” at the Tevatron! • Comparison of PYTHIA Tune A with the pT distribution of charged particles for “min-bias” collisions at CDF Run 1 (non-diffractive cross-section). pT = 50 GeV/c! • PYTHIA Tune A predicts that 12% of all “Min-Bias” events are a result of a hard 2-to-2 parton-parton scattering with PT(hard) > 5 GeV/c (1% with PT(hard) > 10 GeV/c)! Rick Field – Florida/CDF/CMS
CDF: Charged pT Distribution • Published CDF data on the pT distribution of charged particles in Min-Bias collisions (ND) at 1.96 TeV compared with PYTHIA Tune A. Erratum November 18, 2010 Excess events at large pT! No excess at large pT! 50 GeV/c! CDF consistent with CMS and UA1! CDF inconsistent with CMS and UA1! Rick Field – Florida/CDF/CMS
Min-Bias Correlations • Data at 1.96 TeV on the average pT of charged particles versus the number of charged particles (pT > 0.4 GeV/c, |h| < 1) for “min-bias” collisions at CDF Run 2. The data are corrected to the particle level and are compared with PYTHIA Tune A at the particle level (i.e. generator level). Rick Field – Florida/CDF/CMS
Min-Bias: Average PT versus Nchg • Beam-beam remnants (i.e. soft hard core) produces low multiplicity and small <pT> with <pT> independent of the multiplicity. • Hard scattering (with no MPI) produces large multiplicity and large <pT>. • Hard scattering (with MPI) produces large multiplicity and medium <pT>. This observable is sensitive to the MPI tuning! = + + The CDF “min-bias” trigger picks up most of the “hard core” component! Rick Field – Florida/CDF/CMS
CDF Run 1 PT(Z) Tune used by the CDF-EWK group! PYTHIA 6.2 CTEQ5L • Shows the Run 1 Z-boson pT distribution (<pT(Z)> ≈ 11.5 GeV/c) compared with PYTHIA Tune A (<pT(Z)> = 9.7 GeV/c), and PYTHIA Tune AW (<pT(Z)> = 11.7 GeV/c). UE Parameters ISR Parameters Effective Q cut-off, below which space-like showers are not evolved. Intrensic KT The Q2 = kT2 in as for space-like showers is scaled by PARP(64)! Rick Field – Florida/CDF/CMS
Df Jet#1-Jet#2 Jet#1-Jet#2 Df Distribution Jet-Jet Correlations (DØ) • MidPoint Cone Algorithm (R = 0.7, fmerge = 0.5) • L= 150 pb-1 (Phys. Rev. Lett. 94 221801 (2005)) • Data/NLO agreement good. Data/HERWIG agreement good. • Data/PYTHIA agreement good provided PARP(67) = 1.0→4.0 (i.e. like Tune A, best fit 2.5). Rick Field – Florida/CDF/CMS
CDF Run 1 PT(Z) PYTHIA 6.2 CTEQ5L • Shows the Run 1 Z-boson pT distribution (<pT(Z)> ≈ 11.5 GeV/c) compared with PYTHIA Tune DW, and HERWIG. UE Parameters ISR Parameters Tune DW uses D0’s perfered value of PARP(67)! Intrensic KT Tune DW has a lower value of PARP(67) and slightly more MPI! Rick Field – Florida/CDF/CMS
PYTHIA 6.2 Tunes All use LO as with L = 192 MeV! UE Parameters Uses CTEQ6L Tune A energy dependence! (not the default) ISR Parameter Intrinsic KT Rick Field – Florida/CDF/CMS
PYTHIA 6.2 Tunes These are all old PYTHIA 6.2 Tunes! There are now many PYTHIA 6.4 tunes (S320 Perugia 0, Tune Z1) and some PYTHIA 8 tunes (Tune 1, Hendrik tunes). All use LO as with L = 192 MeV! UE Parameters Tune B Tune AW Tune A Old ATLAS energy dependence! (PYTHIA default) Tune BW ISR Parameter Tune DW Tune D6 Tune D Tune D6T Intrinsic KT Rick Field – Florida/CDF/CMS
Min-Bias “Associated”Charged Particle Density 35% more at RHIC means 26% less at the LHC! • Shows the “associated” charged particle density in the “transverse” regions as a function of PTmax for charged particles (pT > 0.5 GeV/c, |h| < 1, not including PTmax) for “min-bias” events at 0.2 TeV and 14 TeVfrom PYTHIA Tune DW and Tune DWT at the particle level (i.e. generator level). The STAR data from RHIC favors Tune DW! ~1.35 ~1.35 0.2 TeV → 14 TeV (~factor of 70 increase) RHIC LHC Rick Field – Florida/CDF/CMS
Min-Bias “Associated”Charged Particle Density • Shows the “associated” charged particle density in the “transverse” region as a function of PTmax for charged particles (pT > 0.5 GeV/c, |h| < 1, not including PTmax) for “min-bias” events at 0.2 TeV, 1.96 TeV and 14 TeVpredicted by PYTHIA Tune DW at the particle level (i.e. generator level). ~1.9 ~2.7 0.2 TeV → 1.96 TeV (UE increase ~2.7 times) 1.96 TeV → 14 TeV (UE increase ~1.9 times) RHIC LHC Tevatron Rick Field – Florida/CDF/CMS
The “Underlying Event” at STAR • At STAR they have measured the “underlying event at W = 200 GeV (|h| < 1, pT > 0.2 GeV) and compared their uncorrected data with PYTHIA Tune A + STAR-SIM. Rick Field – Florida/CDF/CMS
Min-Bias “Associated”Charged Particle Density If the LHC data are not in the range shown here then we learn new (QCD) physics! Rick Field October 13, 2009 RDF LHC Prediction! • Shows the “associated” charged particle density in the “transverse” region as a function of PTmax for charged particles (pT > 0.5 GeV/c, |h| < 1, not including PTmax) for “min-bias” events at 1.96 TeVfrom PYTHIATune A, Tune S320, Tune N324, and Tune P329 at the particle level (i.e. generator level). Tevatron LHC • Extrapolations of PYTHIA Tune A, Tune DW, Tune DWT, Tune S320, Tune P329, and pyATLAS to the LHC. Rick Field – Florida/CDF/CMS
“Transverse” Charged Density • Shows the charged particle density in the “transverse” region for charged particles (pT > 0.5 GeV/c, |h| < 1) at 7 TeVas defined by PTmax, PT(chgjet#1), and PT(muon-pair) from PYTHIATune DWat the particle level (i.e. generator level). Charged particle jets are constructed using the Anti-KT algorithm with d = 0.5. Rick Field – Florida/CDF/CMS
Min-Bias “Associated”Charged Particle Density • Shows the “associated” charged particle density in the “transverse” region as a function of PTmax for charged particles (pT > 0.5 GeV/c, |h| < 1, not including PTmax) for “min-bias” events at 0.2 TeV, 0.9 TeV, 1.96 TeV, 7 TeV, 10 TeV, 14 TeVpredicted by PYTHIA Tune DW at the particle level (i.e. generator level). LHC14 LHC10 LHC7 Tevatron 900 GeV RHIC 0.2 TeV → 1.96 TeV (UE increase ~2.7 times) 1.96 TeV → 14 TeV (UE increase ~1.9 times) RHIC LHC Tevatron Linear scale! Rick Field – Florida/CDF/CMS
Min-Bias “Associated”Charged Particle Density • Shows the “associated” charged particle density in the “transverse” region as a function of PTmax for charged particles (pT > 0.5 GeV/c, |h| < 1, not including PTmax) for “min-bias” events at 0.2 TeV, 0.9 TeV, 1.96 TeV, 7 TeV, 10 TeV, 14 TeVpredicted by PYTHIA Tune DW at the particle level (i.e. generator level). LHC14 LHC10 LHC7 Tevatron 900 GeV RHIC 7 TeV → 14 TeV (UE increase ~20%) LHC7 LHC14 Linear on a log plot! Log scale! Rick Field – Florida/CDF/CMS
Conclusions November 2009 • We are making good progress in understanding and modeling the “underlying event”. RHIC data at 200 GeV are very important! • The new Pythia pT ordered tunes (py64 S320 and py64 P329) are very similar to Tune A, Tune AW, and Tune DW. At present the new tunes do not fit the data better than Tune AW and Tune DW. However, the new tune are theoretically preferred! • It is clear now that the default value PARP(90) = 0.16 is not correct and the value should be closer to the Tune A value of 0.25. • The new and old PYTHIA tunes are beginning to converge and I believe we are finally in a position to make some legitimate predictions at the LHC! • All tunes with the default value PARP(90) = 0.16 are wrong and are overestimating the activity of min-bias and the underlying event at the LHC! This includes all my “T” tunes and the (old) ATLAS tunes! UE&MB@CMS • Need to measure “Min-Bias” and the “underlying event” at the LHC as soon as possible to see if there is new QCD physics to be learned! Rick Field – Florida/CDF/CMS
“Transverse” Charged Particle Density • Fake data (from MC) at 900 GeV on the “transverse” charged particle density, dN/dhdf, as defined by the leading charged particle (PTmax) and the leading charged particle jet (chgjet#1) for charged particles with pT > 0.5 GeV/c and |h| < 2. The fake data (from PYTHIA Tune DW) are generated at the particle level (i.e. generator level) assuming 0.5 M min-bias events at 900 GeV (361,595 events in the plot). Leading Charged Particle Jet, chgjet#1. Prediction! Leading Charged Particle, PTmax. Rick Field MB&UE@CMS Workshop CERN, November 6, 2009 Rick Field – Florida/CDF/CMS