Download
1 / 35
350 likes | 359 Views
This article explores the El Niño-Southern Oscillation (ENSO), the dominant mode of global climate variability on interannual time scales. It provides an overview of the mean state of the tropical Pacific coupled ocean-atmosphere system, the characteristics of El Niño and La Niña events, and their impacts on global climate and economies.

E N D
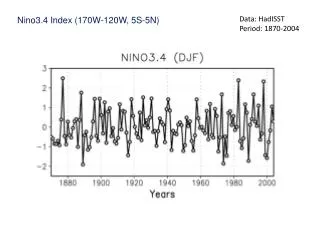
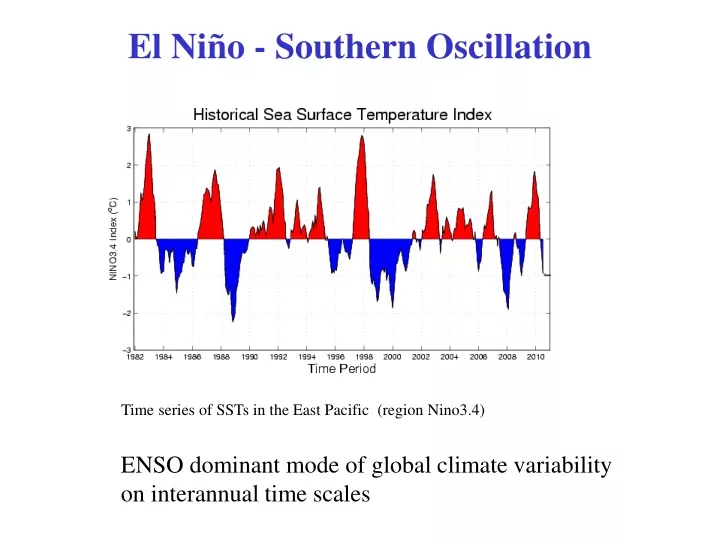
El Niño - Southern Oscillation Time series of SSTs in the East Pacific (region Nino3.4) ENSO dominant mode of global climate variability on interannual time scales
Mean State of the tropical Pacific coupled Ocean-Atmosphere System • Warmest SSTs in west, “cold tongue” in east • Precipitation associated with warmest SSTs • Easterly trade winds advect equatorial surface waters westward
The tropical Pacific thermocline Below surface conditions Surface conditions
The Walker Circulation • Mean ascent, and low surface pressure, over warmest SST associated with deep convection • Subsidence, and high surface pressure, in non-convecting regions • Equatorial trades blow from high to low pressure (balanced by friction since Coriolis force =>0) Low slp High slp
El Nino • During El Nino trade winds slacken • E-W tilt of thermocline & upwelling of cold water are reduced. • SST rises in central/eastern equatorial Pacific • Changes Walker Circulation
SST anomalies during El Nino Dec 1982 Sept 1987
The 1997/98 El Nino Jan 1997 Colors indicate absolute temperatures from the warmest in red (about 28-30deg C) to the coldest in blue (about 12-18deg C)
The 1997/98 El Nino Nov 1997 Jun 1997
The 1997/98 El Nino Nov 1997
The 1997/98 El Nino Mar 1998
The 1997/98 El Nino Mar 1998 Jan 1997 Colors indicate temperature anomalies relative to the long-term meanfrom the warmest in red to coldest in blue.
The 1997/98 El Nino Jun 1997
The 1997/98 El Nino Nov 1997
The 1997/98 El Nino Mar 1998
What about La Nina? In La Nina conditions SST in the central and eastern equatorial Pacific is unusually cold & easterly trade winds are unusually strong Dec 1982 Nov 1988 La Nina conditions sometimes occur in the year following an El Nino event (e.g. 1988 followed 1987 El Nino)
Walker Circulation • British mathematician, director general of observations for India (formed after monsoon failure of 1877- worst famine in Indian history) • Arrived in 1904, shortly after huge famine caused by drought • Goal to predict Indian Monsoon • Found that many global climate variations, including Monsoon rains in India, were correlated with the Southern Oscillation
The Southern Oscillation Index Darwin Tahiti • Mean pressure is lower at Darwin than Tahiti • The term “Southern Oscillation” was also coined by Gilbert Walker • The SOI measures the strength of the Pacific Walker circulation
ENSO Bjerknes recognised that the “El Nino” warming of the ocean was related to variations in the SOI. During El Nino: • SOI is low • Trades are weak • Precipitation is enhanced over central equatorial Pacific (indicated by low OLR)
The “Nino3” SST index Note that El Nino events do not occur regularly
Why is El Nino important? • Major climate and economic impacts on countries around the tropical Pacific, and further afield. • Droughts in some regions, floods in others • Collapse of coastal fishery in Peru (largest average annual catch of marine fish in the world)
TAO Data TAO on Youtube: https://www.youtube.com/watch?v=nzBAWirHMvA Live TAO data: http://www.pmel.noaa.gov/tao/jsdisplay/
Chronology of Events in the History of Understanding El Niño and La Niña late 1800sFishermen coin the name El Niño to refer to the periodic warm waters that appear off the coasts of Peru and Ecuador around Christmas. 1928Gilbert Walker describes the Southern Oscillation, the seesaw pattern of atmospheric pressure readings on the eastern and western sides of the Pacific Ocean.
1957Large El Niño occurs and is tracked by scientists participating in the International Geophysical Year. Results reveal that El Niño affects not just the coasts of Peru and Ecuador but the entire Pacific Ocean. 1969Jacob Bjerknes, of the University of California, Los Angeles, publishes a seminal paper that links the Southern Oscillation to El Niño.
1975Klaus Wyrtki, of the University of Hawaii, tracks sea levels across the Pacific and establishes that an eastward flow of warm surface waters from the western Pacific causes sea surface temperatures to rise in the eastern Pacific. 1976 Researchers use an idealized computer model of the ocean to demonstrate that winds over the far western equatorial Pacific can cause sea surface temperature changes off Peru.
1982A severe El Niño develops in an unexpected manner, but its evolution is recorded in detail with newly developed ocean buoys. 1985Several nations launch the Tropical Ocean-Global Atmosphere (TOGA) program, a 10-year study of tropical oceans and the global atmosphere. 1986Researchers design the first coupled model of ocean and atmosphere that accurately predicts an El Niño event in 1986.
1988Researchers explain how the "memory" of the ocean--the lag between a change in the winds and the response of the ocean--influences terminations of El Niño and the onset of La Niña. 1996-1997The array of instruments monitoring the Pacific, plus coupled ocean-atmosphere models, enable scientists to warn the public of an impending El Niño event.