Download
1 / 62
620 likes | 628 Views
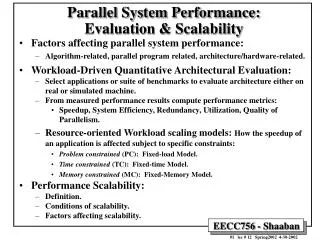
Parallel Performance Evaluation using the TAU Performance System Project. Workshop on Performance Tools for Petascale Computing 9:30 – 10:30am, Tuesday, July 17, 2007, Snowbird, UT Sameer S. Shende sameer@cs.uoregon.edu http://www.cs.uoregon.edu/research/tau Performance Research Laboratory

E N D
Parallel Performance Evaluation using theTAU Performance System Project Workshop on Performance Tools for Petascale Computing 9:30 – 10:30am, Tuesday, July 17, 2007, Snowbird, UT Sameer S. Shende sameer@cs.uoregon.edu http://www.cs.uoregon.edu/research/tau Performance Research Laboratory University of Oregon
Acknowledgements • Dr. Allen D. Malony, Professor • Alan Morris, Senior software engineer • Wyatt Spear, Software engineer • Scott Biersdorff, Software engineer • Kevin Huck, Ph.D. student • Aroon Nataraj, Ph.D. student • Brad Davidson, Systems administrator
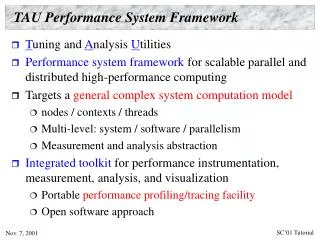
TAU Performance System • Tuning and Analysis Utilities (15+ year project effort) • Performance system framework for HPC systems • Integrated, scalable, flexible, and parallel • Targets a general complex system computation model • Entities: nodes / contexts / threads • Multi-level: system / software / parallelism • Measurement and analysis abstraction • Integrated toolkit for performance problem solving • Instrumentation, measurement, analysis, and visualization • Portable performance profiling and tracing facility • Performance data management and data mining • Partners: LLNL, ANL, LANL, Research Center Jülich
TAU Parallel Performance System Goals • Portable (open source) parallel performance system • Computer system architectures and operating systems • Different programming languages and compilers • Multi-level, multi-language performance instrumentation • Flexible and configurable performance measurement • Support for multiple parallel programming paradigms • Multi-threading, message passing, mixed-mode, hybrid, object oriented (generic), component-based • Support for performance mapping • Integration of leading performance technology • Scalable (very large) parallel performance analysis
TAU Instrumentation Approach • Support for standard program events • Routines, classes and templates • Statement-level blocks • Support for user-defined events • Begin/End events (“user-defined timers”) • Atomic events (e.g., size of memory allocated/freed) • Selection of event statistics • Support for hardware performance counters (PAPI) • Support definition of “semantic” entities for mapping • Support for event groups (aggregation, selection) • Instrumentation optimization • Eliminate instrumentation in lightweight routines
PAPI • Performance Application Programming Interface • The purpose of the PAPI project is to design, standardize and implement a portable and efficient API to access the hardware performance monitor counters found on most modern microprocessors. • Parallel Tools Consortium project started in 1998 • Developed by University of Tennessee, Knoxville • http://icl.cs.utk.edu/papi/
TAU Instrumentation Mechanisms • Source code • Manual (TAU API, TAU component API) • Automatic (robust) • C, C++, F77/90/95 (Program Database Toolkit (PDT)) • OpenMP (directive rewriting (Opari), POMP2 spec) • Object code • Pre-instrumented libraries (e.g., MPI using PMPI) • Statically-linked and dynamically-linked • Executable code • Dynamic instrumentation (pre-execution) (DynInstAPI) • Virtual machine instrumentation (e.g., Java using JVMPI) • TAU_COMPILER to automate instrumentation process
Using TAU: A brief Introduction • To instrument source code using PDT • Choose an appropriate TAU stub makefile in <arch>/lib: % setenv TAU_MAKEFILE /usr/tau-2.x/xt3/lib/Makefile.tau-mpi-pdt-pgi % setenv TAU_OPTIONS ‘-optVerbose …’ (see tau_compiler.sh) And use tau_f90.sh, tau_cxx.sh or tau_cc.sh as Fortran, C++ or C compilers: % mpif90 foo.f90 changes to % tau_f90.sh foo.f90 • Execute application and analyze performance data: % pprof (for text based profile display) % paraprof (for GUI)
User-level abstractions problem domain linker OS Multi-Level Instrumentation and Mapping • Multiple interfaces • Information sharing • Between interfaces • Event selection • Within/between levels • Mapping • Associate performance data with high-level semantic abstractions source code instrumentation preprocessor instrumentation source code instrumentation compiler instrumentation object code libraries executable instrumentation instrumentation runtime image instrumentation instrumentation VM performancedata run
TAU Measurement Approach • Portable and scalable parallel profiling solution • Multiple profiling types and options • Event selection and control (enabling/disabling, throttling) • Online profile access and sampling • Online performance profile overhead compensation • Portable and scalable parallel tracing solution • Trace translation to OTF, EPILOG, Paraver, and SLOG2 • Trace streams (OTF) and hierarchical trace merging • Robust timing and hardware performance support • Multiple counters (hardware, user-defined, system) • Performance measurement for CCA component software
TAU Measurement Mechanisms • Parallel profiling • Function-level, block-level, statement-level • Supports user-defined events and mapping events • TAU parallel profile stored (dumped) during execution • Support for flat, callgraph/callpath, phase profiling • Support for memory profiling (headroom, malloc/leaks) • Support for tracking I/O (wrappers, Fortran instrumentation of read/write/print calls) • Tracing • All profile-level events • Inter-process communication events • Inclusion of multiple counter data in traced events
Types of Parallel Performance Profiling • Flatprofiles • Metric (e.g., time) spent in an event (callgraph nodes) • Exclusive/inclusive, # of calls, child calls • Callpath profiles (Calldepth profiles) • Time spent along a calling path (edges in callgraph) • “main=> f1 => f2 => MPI_Send” (event name) • TAU_CALLPATH_DEPTH environment variable • Phase profiles • Flat profiles under a phase (nested phases are allowed) • Default “main” phase • Supports static or dynamic (per-iteration) phases
Performance Analysis and Visualization • Analysis of parallel profile and trace measurement • Parallel profile analysis • ParaProf: parallel profile analysis and presentation • ParaVis: parallel performance visualization package • Profile generation from trace data (tau2profile) • Performance data management framework (PerfDMF) • Parallel trace analysis • Translation to VTF (V3.0), EPILOG, OTF formats • Integration with VNG (Technical University of Dresden) • Online parallel analysis and visualization • Integration with CUBE browser (KOJAK, UTK, FZJ)
ParaProf Parallel Performance Profile Analysis Raw files HPMToolkit PerfDMFmanaged (database) Metadata MpiP Application Experiment Trial TAU
ParaProf – Flat Profile (Miranda, BG/L) node, context, thread 8K processors Miranda hydrodynamics Fortran + MPI LLNL Run to 64K
ParaProf – Callpath Profile (Flash) Flash thermonuclear flashes Fortran + MPI Argonne
Comparing Effects of MultiCore Processors • AORSA2D on 4k cores • PAPI resource stalls • Blue is single node • Red is dual core
Comparing FLOPS: MultiCore Processors • AORSA2D on 4k cores • Floating pt ins/second • Blue is dual core • Red is single node
ParaProf – Scalable Histogram View (Miranda) 8k processors 16k processors
ParaProf – 3D Full Profile (Miranda) 16k processors
ParaProf – 3D Scatterplot (S3D – XT4 only) • Each pointis a “thread”of execution • A total offour metricsshown inrelation • ParaVis 3Dprofilevisualizationlibrary • JOGL I/O takes less time onone node (rank 0) 6400 cores • Events (exclusive time metric) • MPI_Barrier(), two loops • write operation
S3D Scatter Plot: Visualizing Hybrid XT3+XT4 • Red nodes are XT4, blue are XT3 6400 cores
S3D: 6400 cores on XT3+XT4 System (Jaguar) • Gap represents XT3 nodes
Visualizing S3D Profiles in ParaProf • Gap represents XT3 nodes • MPI_Wait takes less time, other routines take more time
Profile Snapshots in ParaProf • Profile snapshots are parallel profiles recorded at runtime • Used to highlight profile changes during execution Initialization Checkpointing Finalization
Profile Snapshots in ParaProf Filter snapshots (only show main loop iterations)
Profile Snapshots in ParaProf Breakdown as a percentage
Snapshot replay in ParaProf All windows dynamically update
Profile Snapshots in ParaProf Follow progression of various displays through time 3D scatter plot shown below T = 0s T = 11s
New automated metadata collection Multiple PerfDMF DBs
Performance Data Management: Motivation • Need for robust processing and storage of multiple profile performance data sets • Avoid developing independent data management solutions • Waste of resources • Incompatibility among analysis tools • Goals: • Foster multi-experiment performance evaluation • Develop a common, reusable foundation of performance data storage, access and sharing • A core module in an analysis system, and/or as a central repository of performance data
PerfDMF Approach • Performance Data Management Framework • Originally designed to address critical TAU requirements • Broader goal is to provide an open, flexible framework to support common data management tasks • Extensible toolkit to promote integration and reuse across available performance tools • Supported profile formats:TAU, CUBE, Dynaprof, HPC Toolkit, HPM Toolkit, gprof, mpiP, psrun (PerfSuite), others in development • Supported DBMS:PostgreSQL, MySQL, Oracle, DB2, Derby/Cloudscape
K. Huck, A. Malony, R. Bell, A. Morris, “Design and Implementation of a Parallel Performance Data Management Framework,” ICPP 2005. PerfDMF Architecture
Recent PerfDMF Development • Integration of XML metadata for each profile • Common Profile Attributes • Thread/process specific Profile Attributes • Automatic collection of runtime information • Any other data the user wants to collect can be added • Build information • Job submission information • Two methods for acquiring metadata: • TAU_METADATA() call from application • Optional XML file added when saving profile to PerfDMF • TAU Metadata XML schema is simple, easy to generate from scripting tools (no XML libraries required)
Performance Data Mining (Objectives) • Conduct parallel performance analysis process • In a systematic, collaborative and reusable manner • Manage performance complexity • Discover performance relationship and properties • Automate process • Multi-experiment performance analysis • Large-scale performance data reduction • Summarize characteristics of large processor runs • Implement extensible analysis framework • Abstraction / automation of data mining operations • Interface to existing analysis and data mining tools
Performance Data Mining (PerfExplorer) • Performance knowledge discovery framework • Data mining analysis applied to parallel performance data • comparative, clustering, correlation, dimension reduction, … • Use the existing TAU infrastructure • TAU performance profiles, PerfDMF • Client-server based system architecture • Technology integration • Java API and toolkit for portability • PerfDMF • R-project/Omegahat, Octave/Matlab statistical analysis • WEKA data mining package • JFreeChart for visualization, vector output (EPS, SVG)
Performance Data Mining (PerfExplorer) K. Huck and A. Malony, “PerfExplorer: A Performance Data Mining Framework For Large-Scale Parallel Computing,” SC 2005.
PerfExplorer Analysis Methods • Data summaries, distributions, scatterplots • Clustering • k-means • Hierarchical • Correlation analysis • Dimension reduction • PCA • Random linear projection • Thresholds • Comparative analysis • Data management views
PerfDMF and the TAU Portal • Development of the TAU portal • Common repository for collaborative data sharing • Profile uploading, downloading, user management • Paraprof, PerfExplorer can be launched from the portal using Java Web Start (no TAU installation required) • Portal URL http://tau.nic.uoregon.edu
PerfExplorer: S3D Total Runtime Breakdown WRITE_SAVEFILE MPI_Wait 12,000 cores!
TAU Plug-Ins for Eclipse: Motivation • High performance software development environments • Tools may be complicated to use • Interfaces and mechanisms differ between platforms / OS • Integrated development environments • Consistent development environment • Numerous enhancements to development process • Standard in industrial software development • Integrated performance analysis • Tools limited to single platform or programming language • Rarely compatible with 3rd party analysis tools • Little or no support for parallel projects
Add or modifyan Eclipse buildconfiguration w/ TAU C/C++/Fortran Project in Eclipse Temporary copyof instrumented code TAU instrumentedlibraries Compilation/linkingwith TAU libraries Performancedata Programexecution Programoutput Adding TAU to Eclipse • Provide an interface for configuring TAU’s automatic instrumentation within Eclipse’s build system • Manage runtime configuration settings and environment variables for execution of TAU instrumented programs
TAU Eclipse Plug-In Features • Performance data collection • Graphical selection of TAU stub makefiles and compiler options • Automatic instrumentation, compilation and execution of target C, C++ or Fortran projects • Selective instrumentation via source editor and source outline views • Full integration with the Parallel Tools Platform (PTP) parallel launch system for performance data collection from parallel jobs launched within Eclipse • Performance data management • Automatically place profile output in a PerfDMF database or upload to TAU-Portal • Launch ParaProf on profile data collected in Eclipse, with performance counters linked back to the Eclipse source editor
TAU Eclipse Plug-In Features PerfDMF