Download
1 / 23
230 likes | 346 Views
Validating the moisture predictions of AMPS at McMurdo using ground-based GPS measurements of precipitable water. Julien P. Nicolas 1 , David H. Bromwich 1 , and Ian Thomas 2 1 Polar Meteorology Group, Byrd Polar Research Center, The Ohio State University

E N D
Validating the moisture predictions of AMPS at McMurdo using ground-based GPS measurements of precipitable water Julien P. Nicolas1, David H. Bromwich1, and Ian Thomas2 1Polar Meteorology Group, Byrd Polar Research Center, The Ohio State University 2School of Civil Engineering and Geosciences, Newcastle University , UK
Outline • Motivations • Data & background on precipitable water from ground-based GPS • Comparison between PW from observations, AMPS and GPS • Vertical profile of moisture bias in AMPS • Future work • Conclusion
Motivations • Compared to other variables, lower skill of AMPS to predict low-level moisture and cloud cover. • Importance for USAP operations at McMurdo. Aircraft landing requires minimum visibility conditions. • Total precipitable water (PW) can be derived from GPS measurements. • Provides information on the atmospheric moisture content where no radiosonde observations are available. • Benefits of assimilating GPS PW data demonstrated in mid-latitudes. • Vast array of GPS sites recently installed in the Ross Ice Shelf and in West Antarctica. • Similar study was conducted in 2006, but problems with PW data quality
Antarctic GPS network http://www.polenet.org
The “atmospheric corridor” across West Antarctica The Ross Ice Shelf air stream (RAS) CLOUD COVER PRECIP 700-hPa WIND & Q 2M POT. TEMP [Parish and Bromwich, 2007] [Nicolas and Bromwich, 2010]
AMPS data • AMPS archived forecasts for Grid 2 (20 km) • Forecasts generated with Polar WRF 2.2 • Run in parallel to Polar MM5 (switched off in July 08) • Period: Jan. 07 – May 08 • 6-72h forecasts (3 days) Grid 2
PW from ground-based GPS • GPS PW data processed and provided by I. Thomas and colleagues • 2-hourly PW data for 8 Antarctic coastal stations for 2007-05/2008 • Thomas et al. (2008) used 12 years of GPS data, 1995-2006, to study changes in atmospheric moisture at 12 Antarctic stations. They found good agreement between GPS PW and radiosonde observations.
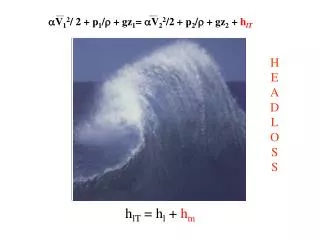
PW from ground-based GPS • Delay in GPS signal between satellite and ground-based GPS receiver due, in part, to the atmospheric moisture content (zenith wet delay) • Knowledge of the mean atmospheric temperature (Tm) required to derive PW • Here, Tm is estimated based on the surface temperature [Bevis et al, 1994]: Tm = 70.2 + 0.72 Ts • The empirical relationship was derived for mid-latitudes (U.S.) [Bevis et al., 1992]
Deriving the mean tropospheric temperature (Tm) JANUARY • Tm estimated from the surface temperature is compared with Tm computed from ERA-40 temperature profiles [Wang et al., 2005] • Dotted areas: Tm(Ts) > Tm(ERA-40) ANNUAL JULY
Deriving the mean tropospheric temperature (Tm) JANUARY • Tm estimated from the surface temperature is compared with Tm computed from ERA-40 temperature profiles [Wang et al., 2005] • Dotted areas: Tm(Ts) > Tm(ERA-40) ANNUAL JULY
Observations • Radiosonde observations at McMurdo are taken from the IGRA database of the National Climatic Data Center. • PW values are calculated by vertical integration of the water vapor mixing ratio (q)
PW time series: Obs, AMPS, GPS AMPS 6-24h fcsts AMPS 30-48h fcsts AMPS 54-72h fcsts GPS
Observed PW vs AMPS & GPS (Bias) AMPS 6-24h fcsts AMPS 30-48h fcsts AMPS 54-72h fcsts GPS
Observed PW vs AMPS & GPS (Bias) AMPS 6-24h fcsts AMPS 30-48h fcsts AMPS 54-72h fcsts GPS
Statistics Number of data used Bias GPS AMPS forecasts 00UTC only 24h 48h 72h 12h 36h 60h RMSD Correlation
Vertical profile of bias in mixing ratio (q) AMPS/PMM5 bias in relative humidity wrt. ice (Dec.03-Jan.05) [Fogt and Bromwich, 2008]
Case study: 16 Jan. 2007, 0000 UTC Bias in q for AMPS fcsts Wind and q at 700 hPa
Future work • Better tuning of PW retrievals for polar regions • Compelling reasons for testing GPS data assimilation in AMPS once GPS data from sites in West Antarctica become available • The Polar WRF can assimilate: • PW retrievals from GPS data • Or directly the zenith wet delay (ZWD) • Requires that GPS data be available for operational assimilation in a timely manner • 3D-Var or 4D-Var? • GPS PW/ZWD assimilation tested for mid-latitudes, data-dense regions only, NOT for the polar, data-sparse Antarctic environment • Validation of AMPS PW for other Antarctic locations
Conclusions Annual precip in the McM region from AMPS • Good quality of GPS-derived PW data (confirms the work from I. Thomas) • AMPS/Polar WRF compares favorably with PW observations • But potential for improvement through GPS data assimilation • Will provide better constraints on moisture fluxes coming from the south [Monaghan et al., 2005]
Acknowledgements • This research is funded by the AMPS Grant from the National Science Foundation, Office of Polar Programs. UCAR Subcontract S01-22961.