Download
1 / 14
140 likes | 288 Views
MBA Student Project Presentation. INEAP Metrics Report Small Business Job Creation Analysis. April 25, 2012. Agenda. Goal: Illustrate your Job Creation Story Project Overview Define Metrics Communicate with Metrics Standardize Metrics Composite Index. Metrics Illustrate Your Story.

E N D
MBA Student Project Presentation INEAP Metrics ReportSmall Business Job Creation Analysis • April 25, 2012
Agenda • Goal: Illustrate your Job Creation Story • Project Overview • Define Metrics • Communicate with Metrics • Standardize Metrics • Composite Index
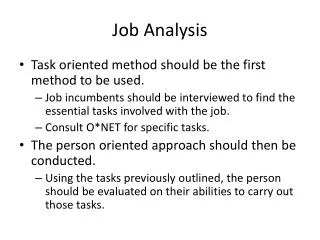
Project Process • Identified Agency Programs • Reviewed PARS, Agency Websites, GAO Reports, US Code • Cataloged Programs and Metrics • Analyzed Metrics • Standard Metrics • Leading, Lagging, and “But for” • Reviewed Industry Best Practices • Generated Final Report • Identified Strengths, Weaknesses, and Opportunities of the Current Usage of Metrics • Dictionary of Terms
Defining Metrics • Leading • Lagging • “But-for”
Communicate Metrics • Develop Targets • Measure Progress • Report Performance • Explain Missed Targets • Report Lessons Learned
Communicate Metrics (Example) One Department uses the following measures to gauge the performance of programs: FY 2012 Missed Targets *SME: Small and Medium Enterprise
Santa Monica Sustainable City Plan • Step 1: Set Goals • Significantly decrease overall community consumption, specifically the consumption of non-local, non-renewable, non-recyclable and non-recycled materials, water, energy and fuels. • Encourage the use of local, non-polluting, renewable and recycled resources • Step 2: Select Leading Metrics • Step 3: Measure Data in Real-time • Step 4: Interpret Data to Make Adjustments
Benefits of Standardization • Cross Evaluation • Continuous Improvement • Greater Impact • Strengthens the Metrics Base
An Opportunity: Composite Index • What is a Composite Index? • Why Composite Index? • How to Construct a Composite Index? • Where to Begin?
In Summary • Choose Metrics that Illustrate Your Story • Solidify Metric Definitions • Use Clear Goals, Metrics, and Targets to Communicate your Efforts • Standardize Metrics Across Job Creation Efforts • Develop a Composite Index to Enhance your Credibility
Kogod MBA Participants MBA Course Participants Raashi Binjrajka Lee Brindel Andres Bu Soto Matthew Cunningham Anthony Frazier Jeffrey Harnois Sam Hedlund Ralph Kirkpatrick Adrian Montgomery Tyler Weymouth Course Instructors William Bailey Alexander Bant Dr. Mark Clark Robert Sicina • For more Information Please Contact: • Robert Sicina • Kogod School of Business • Office 223 • (202) 885-1858 • bsicina@american.edu • Mark Clark • Kogod School of Business • Office 31 • (202) 885-1873 • mark.clark@american.edu