Download
1 / 20
220 likes | 439 Views
TIRS-The Thermal Infrared Sensor on the Landsat Data Continuity Mission . Landsat Science Team Meeting 02/13/2013 Dennis Reuter: TIRS Instrument Scientist 301-286-2042 dennis.c.reuter@nasa.gov Real Credit Goes to the TIRS Instrument Team. TIRS High-level Overview .

E N D
TIRS-The Thermal Infrared Sensor on the Landsat Data Continuity Mission Landsat Science Team Meeting 02/13/2013 Dennis Reuter: TIRS Instrument Scientist 301-286-2042 dennis.c.reuter@nasa.gov Real Credit Goes to the TIRS Instrument Team
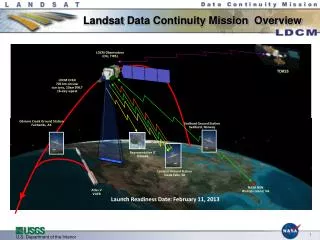
TIRS High-level Overview • TIRS is a two channel thermal imager providing data continuity for the Landsat thermal band. • Pushbroom imager developed by NASA/Goddard Space Flight Center • TIRS operates in concert with, but independently of, OLI. • TIRS will produce radiometrically calibrated, geo-located thermal image data • TIRS will deliver algorithms and parameters necessary to evaluate data and produce required outputs • Final scene data generated as part of the Data Processing and Archive Segment at the United States Geological Survey/ Earth Resources Observation and Science (EROS) facility in Sioux Falls, South Dakota. • USGS responsible for operational algorithms • OLI and TIRS data will be merged into a single data stream. • TIRS was delivered in February 2012. • The TIRS delivery schedule was a significant driver of the overall TIRS development.
TIRS Instrument Overview 2 channel (10.6-11.2 um and 11.5-12.5 um) thermal imaging instrument Quantum Well Infrared Photodetector (QWIP) detector/FPA <120 m Ground Sample Distance (100 m nominal) 185 km ground swath (15º field of view) Operating cadence: 70 frames per second Precision scene select mirror to select between nadir view, onboard variable temperature blackbody and space view Passively cooled telescope assembly operating at 185K (nominal) Actively cooled (crycooler) FPA operating at ≤43K Thermal stability key to radiometric stability (NEDT < 0.4 K @ 300 K)
TIRS Operational and Data Sequence Point SSM to onboard blackbody calibrator (OBC) – take 1 minute of data Provides measure of instrument performance for known target Point SSM to deep space view – take 1 minute of data Provides measure of instrument background Point SSM nadir toward Earth – take up to 77 WRS2 images Subtract background 2 rows of data taken in each channel and in dark area Combined into a single effective row on the ground Generally, all pixels in each row are good. Dark only used if detector temperature is not stable Several additional calibration modes Integration time sweeps OBC temperature change Lunar views Side slither (scan 90º relative to normal direction)
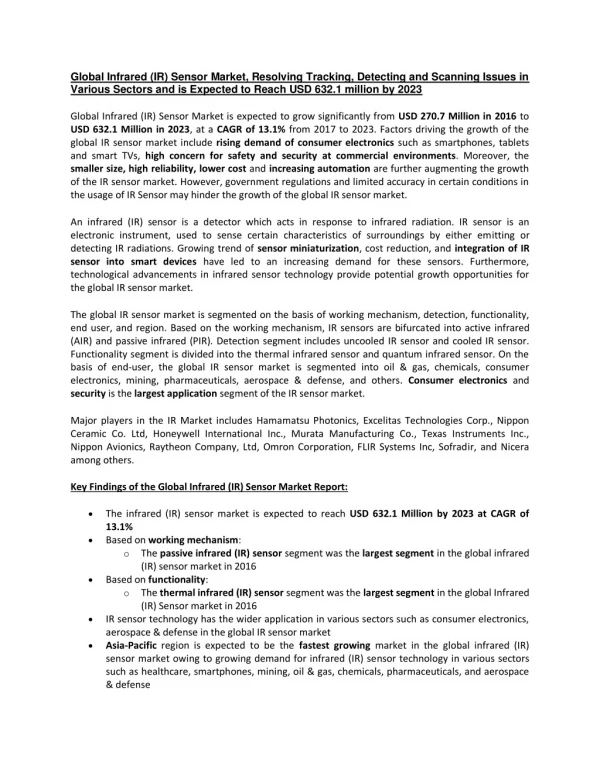
Radiance Detected by TIRS from Surface and Atmosphere TIRS • Emitted and reflected surface radiance • Transmission of atmosphere • Emitted and scattered radiance of atmosphere • Spectral response of detector • Detector integrated radiance Atmosphere TIRS channels Surface
TIRS Assembly Overview TIRS (Earthshield Deployed) TIRS (Earthshield Stowed) Cryocooler Radiator Blackbody Cal Radiator Telescope Radiator Scene Select Mechanism Nadir (Earth) View Captive Earthshield Latch Hinge/Hinge Dampers External Alignment Cube Focal Plane Electronics Spacecraft Interface Flexures (2 of 3) Interconnecting Harness Bracket
TIRS Instrument FOVs X Y Z TIRS FOV Deep Space OLI FOV Nadir
Thermal Design Provides Required Stability • Thermal Zones: • Warm End • Scene Select Mechanism • Scene Select Mirror & Baffles (≤293K) • Stability ±1K (35 sec) • Stability ±2K (44Min) • Blackbody Calibrator (270 to 320K) • Stability ±0.1K (35 sec) • Cold End • Tel Stage: Tel Assembly (185K) • Stability ±0.1K (35 sec) • Stability ±0.25K (44Min) • Warm Stage: FPA Shroud (<88K) • Cold Stage: FPA (<43K) • Stability ±0.01K (35 sec) • Stability ±0.02K (44 min)
HERE’S TIRS Earth View Space View On the Spacecraft, Showing Views Leaving Goddard Space Flight Center
TIRS: GREATER THAN THE SUM OF ITS IMPRESSIVE PARTS QWIP Focal Plane: Makes 2-channel Images Cryocooler: Cools Focal Plane to -385º F Scene Select Mechanism: Points View to 0.0006º Main Electronics and Cryocooler Electronics: Control operations and Save Data Focal Plane Electronics: Reads Images Telescope: Focuses IR Light
Pre-launch Performance Verification • Most performance metrics meet or exceed requirements • Spatial shape parameters slightly out of range • Minor exceedence in two spectral characteristics • DIRSIG simulations indicate non-uniformity effect < 0.1% • Pointing knowledge is slightly out of range • 36 mrad instead of 27 mrad • None of the above exceedences will have a science impact • LDCM cal/val team has concurred on waivers or CCRs where appropriate • NIST radiometric traceability calibration of flood source indicates excellent agreement (~0.3%) with a 0.992 emissivity blackbody • After full implementation of cal routine, expect overall calibration accuracy better than 1% • On-orbit vicarious Earth calibration will also provide verification
Slight Residual Scattering Risk • TVAC2 measurements show 5% scattering effect in some areas which exceeds allowance • Measurement and models indicate this is almost certainly caused by back reflectance into the cal GSE • Exacerbated by necessity of operating SSM at off-nadir angles to reach beyond edge of focal plane • Not done in flight • Nadir SSM measurements show < 0.4% scattering • In the highly unlikely event that in-flight performance shows scattering is in TIRS, data in hand is sufficient to develop numerical correction algorithms
Pre-launch Performance Reports • TIRS-IS-RPT-0089 Calibration Report • TIRS-IS-RPT-0090 Spectral Report • TIRS-IS-RPT-0091 Radiometry Report • TIRS-IS-RPT-0092 Spatial Report • TIRS-IS-RPT-0093 Scatter Report • TIRS-IS-RPT-0094 Bright target recovery Report • TIRS-IS-RPT-0095 Radiometric Calibration Report • TIRS-IS-RPT-0096 Radiometric Precision Report • TIRS-IS-RPT-0097 Noise Report • TIRS-IS-RPT-0098 Pointing Report • TIRS-IS-RPT-0099 Onboard Blackbody Report • Final Access to these may be limited by ITAR etc. • Method to make necessary information available in process
240 K Noise Performance Exceeds Requirements Red line: 10.8 mm Blue line: 12 mm
360 K Noise Performance Exceeds Requirements Red line: 10.8 mm Blue line: 12 mm
Summary of spatial shapes for various assumptions:10.8 mm 10.8um band • Perfect 16-pix circle (black) • Modeled Edge derived from PSF determined from WFE (green) • Measured Edge (blue) • Modeled Edge based on composite PSF for measured (red) • Edge that exceeds requirements (cyan) • Modeled Edge based on composite PSF for required (magenta)
Spatial shape exceedences will not significantly impact science • As seen from previous charts measured shape is not significantly different than required • Measured shape does not take possible GSE effects into account and is a worst case • Lunar observations will be used to verify shapes • DIRSIG simulations using derived PSFs show that only a few percent difference in radiance is expected between measured edge response and required edge response • True even for unphysical case of 60 K change in temperature in a single pixel • Effect much less that 1% for typical thermal gradients
Performance Summary • TIRS performance remained constant through environmental testing • Most performance parameters meet or exceed requirements • Exceedences do not affect science performance • Expect some of the exceedences are in part due to cal GSE • Appropriate waivers and CCRs have been agreed to in principle by cal/val team and Project Scientist • Formal process is ongoing • If necessary, analytical corrections are possible using characterization data in hand. • Fully expect TIRS data to knock your socks off.
IT TAKES A GREAT TEAM WITH INDUSTRIAL PARTNERS ACROSS THE NATION