Download
1 / 37
370 likes | 644 Views
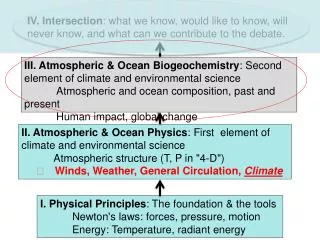
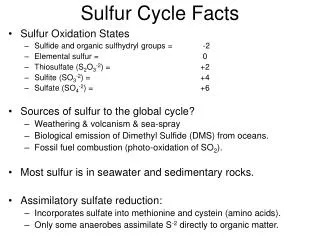
The Role of Rivers in the Global Carbon Cycle: Landscape-Hydrology-Biogeochemistry Connections. Review of overall Rivers cycle. II. In depth analysis of components, to …. Ocean 582/529 Fall ‘03. III. … derive functional models of a geographic-specific global view. GLOBAL RIVER C CYCLE.

E N D
The Role of Rivers in the Global Carbon Cycle: Landscape-Hydrology-Biogeochemistry Connections • Review of overall Rivers cycle II. In depth analysis of components, to …. Ocean 582/529 Fall ‘03 III. … derive functional models of a geographic-specific global view
GLOBAL RIVER C CYCLE ATMOSPHERIC CO2 VEGETATION PPT ->Q ~.4 aw (+:1.8+1.1) COASTAL OCEAN COASTAL OCEAN RIPARIAN RIVERS ESTUARIES DAMS .2 SOILS (+) .2 .1 cw, ~.4aw S&S Litter DIC (pCO2,HCO3) .4 (+) (1)CO2+H20+M(C,Si)O3->M+2HCO3 (2) SOM->CO2 Active SOM,NP (1-2y) POC (.5uM - 1mm) .2 cw .5aw(++) erosion, PPr Int. SOM,NP (20-40y) DOC UV Ox? (P Desorp) .2 (~) Pass, SOM,NP (1000y) DOC (%s < .5uM) leaching Q (N,P,Toxics) PPR .1 cw, ~.4aw .1 cw, ~.4aw .2 ANTHROPOGENIC gigatons/y cw = conventional wisdom aw = alternate wisdom S&S = sensu Sarmiento & Sundquist (+) anthro. effect SHELF SEDIMENTS MCO3 N,P, Toxics
Yenisei Lena Yangsei Mississippi Ganges Orinoco Mekong Brahmaputra Amazon Zaire
Top 10 Rivers 250,000 Amazon 195,000 200,000 Discharge (m3/s) 150,000 0 100,000 Zaire Orinoco 40,000 Yangsei 35,000 Yenisei Mississippi Lena Ganges 50,000 28,000 Mekong Brahmaputra 18,000 16,300 15,800 15,600 14,800 19,000 8 Amazon 6.10 Basin Area (Mkm2) 6 Zaire 3.80 Mississippi 4 3.30 Yenisei Lena 2.60 2.50 Yangsei 1.90 Ganges Orinoco 2 Mekong Brahmaputra 0.98 0.99 0.79 0.61 0 1,500 Amazon 1,200 Huanghe Sediments (MT/y) 1,100 1,200 900 Brahmaputra Ganges Yangsei 540 520 480 600 Irrawaddy Mississippi Magdalena Mekong Godavari 260 210 220 300 160 170 0
7 9 8 6 5 10 4 3 2 1 TOP 10, REST OF RIVERS Sediment Transport: 31,000 MT/y Discharge 1.3 M m3/s 4 3 2 6 5 8 7 9 1 10 Amazon (1) Zaire (2) Orinoco (3) Yangsei (4) Brahmaputra (5) Yenisei (6) Lena (7) Mississippi (8) Ganges (9) Mekong (10) Amazon (1) Huanghe (2) Brahmaputra (3) Ganges (4) Yangsei (5) Irrawaddy (6) Magdalena (7) Mississippi (8) Godavari (9) Mekong (10)
GEOGRAPHIC ZONES AsSE Discharge Ocn 1.3 M m3/s Amazon ErsA Aus EurE AfrE AfrW CAm SAmW EurW AsE SAmE NAmE NAmA NAmW Ocn Sediment Transport 31,000 MT/y Aus EurW ErsA AfrE AfrW NAmW EurE AsE NAmE NAmA SAmW SAmE Amazon AsSE CAm
Consequences for different assumptions in computation of POC yield by geographic zone, ranging from the conventional wisdom of .2 Gt/y , to an area- loading function (.35 Gt/y), and a calculated yield function (.8 Gt/y). Zones Include Oceania (Oce), East and Southeast Asia (AsE, AsSE), South America (North- east SA NE, western SA W, southeast SA SE), North America (West NA W, Atlantic NA ATL, East and Gulf NA EG), Europe & Artic (Atlantic EA At, Eur), Africa (West W, East Afr E) and Australia (Aust). POC Loading by Geographic Region Tg/y 350 "Traditional": 200 Oce Area-loading: 350 300 Calc. Yield: 800 "Best Guess: ~500 ish" 250 200 150 SA NE AsE 100 Afr W AsSE Afr E 50 EA At Eur SA W NA W NA At NA EG SA SE Aust 0
AMAZON TRIBUTARIES 50,000 SPO 40,000 Mad Neg 30,000 Par 20,000 Jap Pur Xin Tap 10,000 Ica Jur Jut Tro 0 par = sum "parana" Tap, Xin approx Tocantins not incl
ATMOSPHERE SOILS DAMS RIVERS Coastal Zone STREAMS RIPARIAN FLOODPLAINS FLUVIAL SYSTEMS BOX MODEL
-1.0 0.0 1.0 2.0 -2.0 CW+CS+OC+OG CW+CS+(POC,DOC) CW + Continent Sediment Conventional Wisdom Transient 1.3 1.8 River← Atm 2.6 0.6 1.3 Cont Sed ↓ ↓ ↓ Outgassing ↑ ? DIC →sea ? DOC →sea 2x 2x 2.5x POC → sea 2.5x - 1.1 - 1.6 Δ Net Atm - 0.6 - 0.2 - 0.3 Gt C/y PATHWAYS OF ATMOSPHERIC CO2 THROUGH FLUVIAL SYSTEMS Atmosphere Soils Dams Rivers Coastal Zone Streams Riparian Floodplains Richey, J.E. (in press). Ch. 15. Field et al (eds) A SCOPE/GCP Rapid Assessment Project. Island Press.
River Routing and Sediment Transport Network Gas Exchange Land Surface Processes (Grid) Deposition Upland Surface Water Riparian/Floodplain Erosion Floodplain mineral soil Water and dissolved Reservoirs Free-Flowing Fresh OM River Routing Particulate Estuary/Delta STRUCTURE OF LAND-FLUVIAL SYSTEMS
SCALING Amazon Floodplain from Aircraft: ‘eye’ Xingu (Amazon trib) from AVHRR: 1 km Amazon Floodplain from Landsat TM: 30 m Taiwan: AVHRR to Global 1-degree (~100 km)
Global CASA calibration Sn Albedo FPAR NPP(t) = emax * Te (t) * We (t) * FPAR (t) * PAR(t) Surf. Temperature Sn, Temp., Rain, Ln, Soils, Roots Water Stress Scalar Formulation: We(t) = 0.5 [1 + ET(t) / PET(t)] From hydrology model “HYDROLOGY” IN A REGIONAL NPP MODEL(e.g., CASA)
1983 1987 1985 1990 6 N 20 S -500 -250 0 250 500 Latitude INIT 82 83 84 85 86 87 88 89 90 g C m-2 yr-1 -1.0 -0.5 0 0.5 1.0 Tg C 8-km-1 mo-1 INTERANNUAL NPP MODEL (CASA Potter et al)
Streams (< 100 m) STREAMS & RIPARIAN (< 100 m)
3 0 Sources & Implicit Dynamics? 40% 14C: Downstream Translocation Space & Time 30% T (>100m) 2 5 DIC - UDOC -FPOC -CPOC 20% 2 0 CO2 Evasion (Tg C mo-1) 10% 1 5 14C 0% Plankton Soil CO2 Soil DOC Litter- fall Macro- phytes 1 0 MF S (<100 m) 5 MC 0 Low-Elevation High-Elevation J F M A M J J A S O N D CO2 EVASION: FROM WATER → ATMOSPHERE : 1.2 ± . 3 Mg C ha-1 y-1 (basin ~ .5 Gt y-1)
CH4 and CO2 Emissions Central Amazon Basin (1.77 million km2) Methane Emission CO2 Evasion Tg C y-1 Tg C y-1 7.6 + 2.3 210 + 60 Lowland Amazon Basin (5.19 million km2) Methane Emission 25 + 8 Tg C y-1 Greenhouse gas potential ~ 0.5 Pg C y-1 as CO2
ENSO-Orchestrated Sediment Accumulation on Bolivian Amazon floodplains (Aalto et al. Nature 2003) [& utility of SRTM] IMPORTANCE OF EPISODIC EVENTS
Increase in the export of alkalinity from North America’s largest river (Raymond & Cole, Science, 2003) NORTH AMERICA: “ambiguous, but provocative” Long-term decline in carbon dioxide super- saturation in rivers across the contiguous United States. (Jones et al, Geophys Res Lett in press)
RECENT GBC Publications on Trace Gas Sources & Sinks in Peatlands, Tundra, Rice paddies, Savannas; as f(water table depth, flow regimes…) Torben Christensen “….a good understanding of local controls … does not necessarily explain large scale gradients…..” Progress, but not there yet…….
NAGA Version 2 (1-km)Physical Template, Dynamic Modeling, Drivers
(REGIONAL) HYDROLOGY ←→BGC: Q= ΣR = P – ET + ΔSM
Rn LAI T Soil Moisture → Discharge → Trace Gas Biogeochemistry HYDROLOGY MODEL “FIELDS”
Tg/y 350 "Traditional": 200 Oce Area-loading: 350 300 Calc. Yield: 800 "Best Guess: ~500 ish" 250 Average OC concentration of Fly-Strickland river samples ~ 3.75% (June ’03) 200 150 SA NE AsE 100 Afr W AsSE Afr E 50 EA At Eur SA W NA W NA At NA EG SA SE Aust 0 UNCERTAINTIES IN POC LOADING BY GEOGRAPHIC REGION
ENSO-Orchestrated Sediment Accumulation on Bolivian Amazon floodplains (Aalto et al. Nature 2003) [& utility of SRTM] IMPORTANCE OF EPISODIC EVENTS
C O f i x a t i o n 2 Production via Terrestrial Biosphere Model Production via Terrestrial Biosphere Model w a t e r f l u x c a r b o n f l u x N2, NOx CO2 CO2, CH4 NH3 a u t o t r o p h i c Living Organic Carbon r e s p i r a t i o n Living Organic Nitrogen a t i o n Detrital Particulate Organic Matter (>2mm) Detrital Particulate Organic Matter (>2 mm) Metabolic C (soluble) Structural C (insoluble) p h y s i c a l f o r c i n g v i a r e m o t e s e n s i n g Metabolic N (soluble) Structural N (insoluble) ( s o l a r r a d i a t i o n , F P A R , r a i n f a l l , t e m p e r a t u r e ) D O C P O C D I C CPOM (63 um - 2 mm) t e r r e s t r i a l N P P DIC Nitrogen a n d b i o m a s s t u r n o v e r Carbon v i a C A S A e c o s y s t e m m o d e l CPOM (63 um - 2 mm) CPOC h y d r o l o g y CPON h e t e r o t r o p h i c v i a V I C m o d e l r e s p i r C O e v a s i o n 2 DOM (>0.1 µm) Mineral-Associated OM (FPOM) (0.1 µm - 63 µm) Mineral-Associated OM (FPOM) (0.1 µm - 63 µm) DOM (>0.1 µm) VHMW DOC (>30 kDa) VHMW FPOC (>30 kDa) D O C , D I C a q u a t i c b i o g e o c h e m i s t r y s o i l b i o g e o c h e m i s t r y v i a R O M B U S m o d e l v i a R O M B U S m o d e l VHMW DON (>30 kDa) VHMW FPON (>30 kDa) HMW DOC (1-30 kDa) HMW FPOC (1-30 kDa) g e o g r a p h i c a l p r o p e r t i e s v i a G I S ( v e g e t a t i o n , s o i l , t o p o g r a p h y , r i v e r n e t w o r k , e t c . ) LMW DON (200-1000Da) LMW FPON (200-1000Da) LMW DOC (<1 kDa) LMW FPOC (<1 kDa) VLMW DON (<200Da) VLMW FPON (<200Da) Black C (soot and charcoal) CH4 Sorbed NH4 NH4 Biotic fluxes Abiotic fluxes NO3 ROMBUS (River basin Organic Matter and Biogeochemistry Synthesis Model)