Download
1 / 1
20 likes | 149 Views
Determining Recovery Trajectories and Terminal Rehabilitation Potential Variations Following Traumatic Brain Injury Jessica Ashley Ph.D., Mark Ashley Sc.D., Lisa Kreber Ph.D., Philip Seneca Ph.D. Centre for Neuro Skills, Bakersfield, CA, United States. Background

E N D
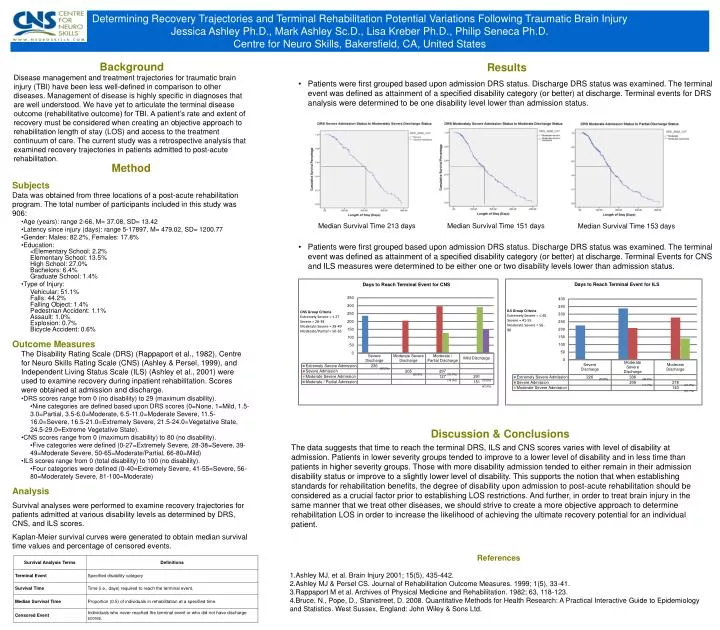
Determining Recovery Trajectories and Terminal Rehabilitation Potential Variations Following Traumatic Brain Injury Jessica Ashley Ph.D., Mark Ashley Sc.D., Lisa Kreber Ph.D., Philip Seneca Ph.D. Centre for Neuro Skills, Bakersfield, CA, United States Background Disease management and treatment trajectories for traumatic brain injury (TBI) have been less well-defined in comparison to other diseases. Management of disease is highly specific in diagnoses that are well understood. We have yet to articulate the terminal disease outcome (rehabilitative outcome) for TBI. A patient’s rate and extent of recovery must be considered when creating an objective approach to rehabilitation length of stay (LOS) and access to the treatment continuum of care. The current study was a retrospective analysis that examined recovery trajectories in patients admitted to post-acute rehabilitation. • Results • Patients were first grouped based upon admission DRS status. Discharge DRS status was examined. The terminal event was defined as attainment of a specified disability category (or better) at discharge. Terminal events for DRS analysis were determined to be one disability level lower than admission status. • Patients were first grouped based upon admission DRS status. Discharge DRS status was examined. The terminal event was defined as attainment of a specified disability category (or better) at discharge. Terminal Events for CNS and ILS measures were determined to be either one or two disability levels lower than admission status. • Method • Subjects • Data was obtained from three locations of a post-acute rehabilitation program. The total number of participants included in this study was 906: • Age (years): range 2-66, M= 37.08, SD= 13.42 • Latency since injury (days): range 5-17897, M= 479.02, SD= 1200.77 • Gender: Males: 82.2%, Females: 17.8% • Education: • <Elementary School: 2.2% • Elementary School: 13.5% • High School: 27.0% • Bachelors: 6.4% • Graduate School: 1.4% • Type of Injury: • Vehicular: 51.1% • Falls: 44.2% • Falling Object: 1.4% • Pedestrian Accident: 1.1% • Assault: 1.0% • Explosion: 0.7% • Bicycle Accident: 0.6% • Outcome Measures • The Disability Rating Scale (DRS) (Rappaport et al., 1982), Centre for Neuro Skills Rating Scale (CNS) (Ashley & Persel, 1999), and Independent Living Status Scale (ILS) (Ashley et al., 2001) were used to examine recovery during inpatient rehabilitation. Scores were obtained at admission and discharge. • DRS scores range from 0 (no disability) to 29 (maximum disability). • Nine categories are defined based upon DRS scores (0=None, 1=Mild, 1.5-3.0=Partial, 3.5-6.0=Moderate, 6.5-11.0=Moderate Severe, 11.5-16.0=Severe, 16.5-21.0=Extremely Severe, 21.5-24.0=Vegetative State, 24.5-29.0=Extreme Vegetative State). • CNS scores range from 0 (maximum disability) to 80 (no disability). • Five categories were defined (0-27=Extremely Severe, 28-38=Severe, 39-49=Moderate Severe, 50-65=Moderate/Partial, 66-80=Mild) • ILS scores range from 0 (total disability) to 100 (no disability). • Four categories were defined (0-40=Extremely Severe, 41-55=Severe, 56-80=Moderately Severe, 81-100=Moderate) • Analysis • Survival analyses were performed to examine recovery trajectories for patients admitted at various disability levels as determined by DRS, CNS, and ILS scores. • Kaplan-Meier survival curves were generated to obtain median survival time values and percentage of censored events. Median Survival Time 213 days Median Survival Time 151 days Median Survival Time 153 days Discussion & Conclusions The data suggests that time to reach the terminal DRS, ILS and CNS scores varies with level of disability at admission. Patients in lower severity groups tended to improve to a lower level of disability and in less time than patients in higher severity groups. Those with more disability admission tended to either remain in their admission disability status or improve to a slightly lower level of disability. This supports the notion that when establishing standards for rehabilitation benefits, the degree of disability upon admission to post-acute rehabilitation should be considered as a crucial factor prior to establishing LOS restrictions. And further, in order to treat brain injury in the same manner that we treat other diseases, we should strive to create a more objective approach to determine rehabilitation LOS in order to increase the likelihood of achieving the ultimate recovery potential for an individual patient. • References • Ashley MJ, et al. Brain Injury 2001; 15(5), 435-442. • Ashley MJ & Persel CS. Journal of Rehabilitation Outcome Measures. 1999; 1(5), 33-41. • Rappaport M et al. Archives of Physical Medicine and Rehabilitation. 1982; 63, 118-123. • Bruce, N., Pope, D., Stanistreet, D. 2008. Quantitative Methods for Health Research: A Practical Interactive Guide to Epidemiology and Statistics. West Sussex, England: John Wiley & Sons Ltd.