Download
1 / 31
320 likes | 381 Views
Plotting parabolas. When you complete a table of values for y = 2x – 3 , You get a STRAIGHT LINE. When you complete a table of values for y = x 2 + 5x – 6 , You get a PARABOLA, which is a CURVE. It’s the x 2 that makes the graph curve. If the x 2 wasn’t there, you would just have a line!.

E N D
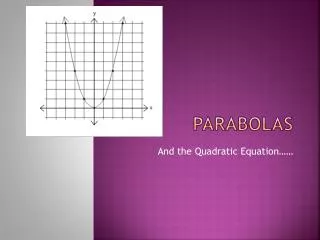
Plotting parabolas When you complete a table of values for y = 2x – 3 , You get a STRAIGHT LINE When you complete a table of values for y = x2 + 5x – 6 , You get a PARABOLA, which is a CURVE.It’s the x2 that makes the graph curve. If the x2wasn’t there, you would just have a line!
So let’s try plotting y = x2 – 5x + 6 using a table of values. First choose a few x-values and make sure they’re in order and spaced 1 apart. Now one by one, put these into the equation y = x2 - 5x + 6, being sure to bracket negatives when squaring them (they become positives!!) Begin with x = -2 (–2)2 – 5 (– 2) + 6 = 4 + 10 + 6 = 20 So our first point is (2, 20)
Now continue the same process for the rest of the numbers. And plot them on a grid and join with a smooth curve 12 6 2 0 0 2 6 12 20 30
Plotting parabolas There is an alternative to the sometimes laborious “box” method of plotting parabolas. This alternative uses the y-intercept, the x-intercepts and the turning point to get a graph. Once you become practised at this you will find it quicker than boxes and substitution.
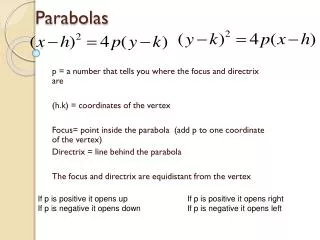
Important info When you solve a quadratic such as 0 = x2 + x - 6 y = 0 at these 2 pts You are actually finding the two x-intercepts of the parabola y = x2 + x - 6 because these are the points where y = 0 So here we go…. This means that the parabola y = x2 + x - 6 will have x-intercepts equal to -3 and 2 x2 + x - 6 = 0 ( x + 3 )(x – 2) = 0 x = -3 or x = 2
y = x2 + x - 6 x-intercepts are -3 and 2
Example 1 Plot the graph of y = x2 – 5x + 6, by first finding the x and y intercepts, and its turning point. So we now have our first point for our parabola….. STEP 1 Start with the y-intercept as it’s the easiest. It’s the y-value you get when you make x = 0. It’s also very easy to recognise it as the number on its own, i.e. +6.
y-intercept (0, 6)
STEP 2 Now we’ll do the x-intercepts – they require a bit more work. See “IMPORTANT INFO” on Slide #2. They’re the x-values you get when you make y = 0. So this means we have to solve the quadratic equation 0 = x2 – 5x + 6 . The process is a familiar one!!! Factorise then solve x2 – 5x + 6 = 0 First we factorise the quadratic Δ x ◊ = 6 gives -2 and -3 Δ + ◊ = -5 (x – 2)(x – 3) = 0 so either x – 2 = 0 x – 3 = 0 These are the x-intercepts or which gives x = 3 x = 2
y-intercept (0, 6)
STEP 3 Now for the TURNING POINT If your parabola is written as y = ax2 + b x + c, then the turning point’s coordinates can be found from the formula So in y = x2 – 5x + 6, first write down what a, b and c are: 1 – 5 + 6 c = 6 a = 1 b = -5
a = 1, b = -5, c = 6 so we substitute these values into our formula and use the calculator to work it out…. and this will give us our turning point For the bright sparks! You may have noticed that the x-value of the turning point is always midway between the 2 x-intercepts. This is another reliable way of finding the turning point and avoids using the formula above!Here, x-intercepts were 2 and 3, so the turning point’s x-value is 2.5 ! Find y by substituting 2.5 into the formula y = x2 – 5x + 6 and this will give y = -0.25
axis of symmetry is the vertical line x = 2.5 (2.5, –0.25) y-intercept (0, 6) Now you can plot the graph! You may wish to plot a few extra points to help with accuracy.
-4 0 2 0 Example 2 Plot the graph of y = x2 + 2x - 8 using intercepts and turning point. State equation of axis of symmetry. This is the number on its own, -8 STEP 1 – y intercept. STEP 2 – x intercepts. Found by making y = 0 and solving x2 + 2x – 8 = 0 x2 + 2x – 8 = 0 (x + 4)(x – 2) = 0 x + 4 = 0 OR x – 2 = 0 x = - 4 OR x = 2
STEP 3 – Turning point. a = 1, b = 2, c = -8 y = x2 + 2x - 8 -4 0 2 0 -1 -9
axis of symmetry x = -1 (-4, 0)x-intercept (2, 0)x-intercept (0, -8)y-intercept (-1, -9)turning pt
0 0 3 0 Example 3 Plot the graph of y = 3x - x2 using intercepts and turning point. STEP 1 – y intercept. This is the “invisible” number on its own, 0 STEP 2 – x intercepts. Found by making y = 0 and solving 3x – x2 = 0 3x - x2 = 0 Sign change ….x2 – 3x = 0 x(x – 3) = 0 x = 0 OR x – 3 = 0 x = 0 OR x = 3 Note that here we get a repeat!! (0,0)
0 0 3 0 STEP 3 – Turning point. a = -1, b = 3, c = 0 y = 3x - x2 1.5 2.25
axis of symmetry x = 1 y-intercept AND one of the x-intercepts (0,0) (1.5, 2.25) turning pt (3,0) x intercept
Important Note! Of the 3 parabolas we graphed, only the last one had a negative in front of the x2. Its graph was upside down!
h d Problem Solving... The entrance to a railway tunnel forms a parabolic arch. At any distance d across the base of the tunnel, starting from the left, the height h is found using the equation h = -d 2 + 6d We can represent the tunnel as a graph….see over
4m From this diagram you can see that………… h = -d2 + 6d the base of the tunnel is 6m wide becomes the height of the tunnel is 9m at its highest point y = -x2 + 6x for graph drawing purposes A train is 4m wide and 4m tall. Would it be able to pass through? YES! But only just!
How high is the tunnel 1m along the base from either side of the tunnel? The base points are at 1 and 5. Moving up to meet the graph, we can see that these will be 5 up. The tunnel is therefore 5m high at points 1m in from either side
Quadratic Toughies & Weirdos
In all these questions you must aim to eventually end up with a STANDARD QUADRATIC FORMAT, which looks like ax2 + bx + c = 0 where the a, b and c are just numbers, and most importantly, you have ZERO on one side!
Solve the equation Example 5 Solution Must get 0 on one side, so subtract the 4: x2 + 3x – 4 = 0 This is now in regular quadratic format so factorise and follow normal routine…. Answers x = -4 x = 1 (x + 4)(x – 1) = 0 x + 4 = 0 or x – 1 = 0
Solve the equation Example 6 Solution Must get 0 on one side, so subtract the x and place it in the middle between the x2 and the -6: x2 - x – 6 = 0 This is now in regular quadratic format so factorise and follow normal routine…. Answers x = 3 x = -2 (x - 3)(x + 2) = 0 x - 3 = 0 or x + 2 = 0
Solve the equation Example 7 Solution Must get 0 on one side, so add x2: 0 = x2 + 2x - 24 This is now in regular quadratic format so factorise and follow normal routine…. Answers x = -6 x = 4 (x + 6)(x - 4) = 0 x + 6 = 0 or x - 4 = 0
Solve the equation Example 8 STEP 1 – get rid of any fractions. In this case, multiply all three terms by x STEP 2 – make 0 on right hand side. In this case, take 6 from both sides STEP 3 – Factorise and solve using familiar routine x = 6 or x = -1 So….