Download
1 / 18
180 likes | 334 Views
OMB Data Visualization Tool Requirements Analysis: IBM. Dr. Brand Niemann Director and Senior Data Scientist Semantic Community http://semanticommunity.info/ AOL Government Blogger http://breakinggov.com/author/brand-niemann/ July 27, 2013

E N D
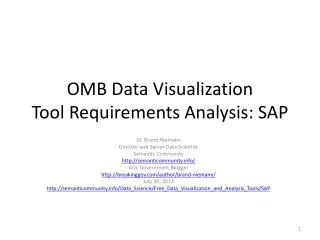
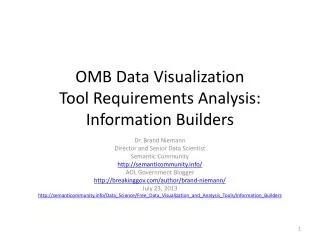
OMB Data Visualization Tool Requirements Analysis: IBM Dr. Brand Niemann Director and Senior Data Scientist Semantic Community http://semanticommunity.info/ AOL Government Blogger http://breakinggov.com/author/brand-niemann/ July 27, 2013 http://semanticommunity.info/Data_Science/Free_Data_Visualization_and_Analysis_Tools/IBM
Background • DRAFT White Paper for OMB Pittsburgh, July 11, 2013. • Start With the End in Mind, Avoid Tool and Turf Wars, and Develop Well-designed Spreadsheets That Can be “Dragged and Dropped” Onto a Tool That Creates Statistics and Visualizations in the Public and Private Clouds. • Focus on Requirements Analysis by First Comparing Magic Quadrant Leaders and Challengers on Common Data Sets. • Spotfire Was Able to Reproduce Birst, Information Builders, Logi Analytics, Microsoft, QlikView, SAS, and Tableau Data Visualizations With Dynamically Linked Visualizations. • Broaden This Requirements Analysis to Include More Sample Data Sets and Tools. • IBM Is a Leader in the Gartner Magic Quadrant.
Gartner BI Magic Quadrant: IBMIBM Analytics Strengths and Cautions Excerpts • Analytic Answers was another significant offering added recently. Gartner has predicted that, by 2014, up to 40% of analytics projects will be service-led and software-supported. IBM, delivering "analytics as a service," will enable organizations to mitigate one of the most critical nontechnical barriers to advanced analytics adoption: the lack of analytical skills. Analytic Answers is not simply a cloud offering that enables a shorter time to market, or turns capital expenditure into operating expenditure to encourage business analytics adoption. Rather, it is an analytics platform with prebuilt, domain-specific data models and embedded, relevant, statistical and advanced analytical algorithms that offer answers to industry-specific questions. This offering will enable IBM to effectively leverage its complete analytical assets — including analytical software, hardware, analytical knowledge, industrial practices, intellectual property and cloud delivery model — to allow maximum user access to IBM advanced analytics capabilities. • Performance remains a concern, although primarily with the Cognos 8 BI base. • References continue to cite the Cognos products as more difficult to use. • My Note: I added from the Many Eyes FAQ: Many Eyes was created in 2007 by the Visual Communication Lab, part of Collaborative User Experience group, at IBM Research. It is brought to you now jointly by the Visual Communication Lab and the IBM Cognos software group. • http://www-958.ibm.com/software/analytics/manyeyes/page/FAQ.html Note: Bolding by the author to highlight key points. Source: http://www.gartner.com/technology/reprints.do?id=1-1DYKLUR&ct=130206&st=sb
IBM Many Eyes: Home Page An experiment brought to you by IBM Research and the IBM Cognos software group http://www-958.ibm.com/software/analytics/manyeyes/
IBM Many Eyes: Visualizations Showing 1-30 of 164,419 http://www-958.ibm.com/software/analytics/manyeyes/visualizations
IBM Many Eyes: Data Sets Showing 1-30 of 408,317 http://www-958.ibm.com/software/analytics/manyeyes/datasets
IBM Many Eyes: People https://www-958.ibm.com/software/analytics/manyeyes/login
IBM Many Eyes: Comments http://www-958.ibm.com/software/analytics/manyeyes/comments
IBM Many Eyes: Example Many Eyes uses Java and Flash technology. My Note: I did this but it kept crashing my Google Chrome Browser! http://www-958.ibm.com/software/analytics/manyeyes/visualizations/summer-and-winter-olympic-games-me
IBM Many Eyes: Steps & Options Compare a set of values Bar Chart Block Histogram Bubble Chart Track rises and falls over time Line Graph Stack Graph Stack Graph for Categories See the parts of a whole Pie Chart Treemap Treemap for Comparisons Analyze a text Word Tree Tag Cloud Phrase Net Word Cloud Generator See the world Ottawa Neighborhood Map US County Map World Map Massachusetts Map New Jersey Map Finding the right way view your data is as much an art as a science. The visualizations provided on Many Eyes range from the ordinary to the experimental. See relationships among data points Scatterplot Matrix Chart Network Diagram http://www-958.ibm.com/software/analytics/manyeyes/page/create_visualization.html http://www-958.ibm.com/software/analytics/manyeyes/page/Visualization_Options.html
IBM Many Eyes: 2013 Beta Welcome My Note: Internet Explorer will be fully supported later in the beta period. My Note: “Data Stories and Data Science ” http://www-958.ibm.com/software/analytics/labs/manyeyes/
IBM Many Eyes: 2013 Beta Steps & Options Compare a Set of Values Word Tree Word Cloud Phrase Net Track Rises and Falls Over Time Bar Chart Block Histogram Bubble Chart View in Context See Parts of a Whole Heat Map Pie Chart Tree Map Scatter plot http://www-958.ibm.com/software/analytics/labs/manyeyes/#create
IBM Many Eyes: 2013 Beta Step 1 http://www-958.ibm.com/software/analytics/labs/manyeyes/#create
IBM Many Eyes: 2013 Beta Step 2 http://www-958.ibm.com/software/analytics/labs/manyeyes/#create
IBM Many Eyes: 2013 Beta Step 2 Many Eyes uses Java and Flash technology. My Note: This kept crashing my Google Chrome Browser! http://www-958.ibm.com/software/analytics/labs/manyeyes/#create
Guardian 2012 Summer Olympic Medals: Spotfire Client https://silverspotfire.tibco.com/us/library#/users/bniemann/Public?GuardianOlympicMedals-Spotfire
Guardian 2012 Summer Olympic Medals: Spotfire Web Player https://silverspotfire.tibco.com/us/library#/users/bniemann/Public?GuardianOlympicMedals-Spotfire
Some Conclusions and Recommendations • Semantic Community Was Unable to Import An Excel File Into Many Eyes 2013 Beta and Create a Simple Graphic Without Crashing the Google Chrome Browser. • Spotfire Provides Similar Features To IBM Many Eyes (Original and 2013 Beta), But the Author Finds Spotfire Much Easier and More Reliable to Use. • MindTouch and Spotfire Are More Versatile Than IBM Many Eyes For Mashups. • Semantic Community Will Continue to Use The Gartner BI Magic Quadrant Leader Tools and Their Sample Data Sets and to Recreate Visualizations and Dashboards.