Download
1 / 21
210 likes | 384 Views
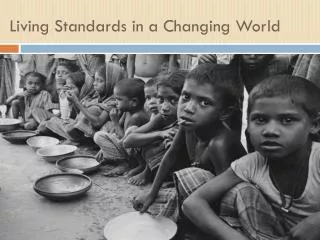
Living Standards of Vietnamese provinces: a Kohonen map. Dominique Haughton NguyÔn Phong. Agenda. Research question Kohonen maps: principle and basic algorithm Vietnamese variables used for Kohonen map What can be seen from the maps? Findings Further research issues. Research Question.

E N D
Living Standards of Vietnamese provinces: a Kohonen map Dominique Haughton NguyÔn Phong
Agenda • Research question • Kohonen maps: principle and basic algorithm • Vietnamese variables used for Kohonen map • What can be seen from the maps? • Findings • Further research issues
Research Question • Which province is better off? • What indicators should be used to rank provinces? • Single indicators like GDP, income per capita, or poverty rate • Composed indicators like HDI • Others
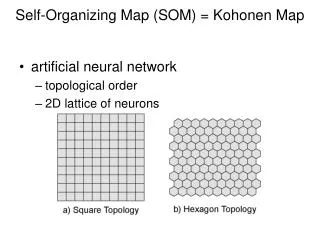
Kohonen maps: principle • Kohonen maps, due to Kohonen in Finland, are a special case of a competitive neural network • Also referred to as Self Organizing maps • Matlab toolbox to build Kohonen maps available at: http://www.cis.hut.fi/projects/somtoolbox/
Kohonen maps: basic algorithm • Begin with a grid, typically 2-dimensional, with a vector mi(t) assigned to each grid position, initially typically randomly, of the same dimension as the number of variables • For each data vector x(t) find the best match c on the grid such as:
Kohonen maps: basic algorithm • Update the vectors mi(t) as follows: • Here is the neighborhood function, a decreasing function of the distance between the ith and cth vector on the grid.
Kohonen maps: basic algorithm • Iterate this step over all available data vectors • The resulting map tends to organize the components of the estimated vectors, the mi(t), in a monotonic way (increasing or decreasing) (hence the term Self Organizing Maps)
Vietnamese variables used for Kohonen map • Hhsize: Household size • Mincpccurpric: Avge income per cap. (current prices) • Percincagri: % income from agriculture • Mexppccurpric: Avge exp. per cap. (current prices) • Percexpfood: % exp. allocated to food • Valdurgoods: Avge value of durable goods • Percpermhouse: % permanent houses • Livareapc: Avge living area per cap. • Povrate: Poverty rate • Ginicoeff: Gini coefficient
Vietnamese variables used for Kohonen map (cont.) • Percskill: % 13 + with skilled certificate • Percfemskill: % female 13+ with skilled certificate • Perctechwk: % technical workers • Percvocswc: % with vocational sec. school diplomas • Percunivcoll: % with university and college diplomas • Percmsphd: % with Masters and PhD degrees • Schlen3to5: School enrollment rate ages 3-5 • Schlen6less: School enrollment rate ages under 3 • Schlenprim: Primary school enrollment rate • Schlenlowsec: Lower secondary school enrollment rate • Schlenlowsef: Lower secondary school enrollment rate (females)
Vietnamese variables used for Kohonen map (end) • Schlenupsef: Upper secondary school enrollment rate (females) • Schlenupse: Upper secondary school enrollment rate • Wgtforht: Weight for height malnutrition • Htforage: Height for age malnutrition • Wgtforage: Weight for age malnutrition • Matdeathp1000: Number of pregnancy related deaths per 1000 • Adlircy: Adult literacy rate • Gdppc99vnd: GDP per cap. in 99 VND • Lifexpmale: Life expectancy (male) • Lifexpfem: Life expectancy (female) • Infmort: Infant mortality rate
1 2 4 5 3 1 2 1 3 4 5 6 7 8
What can be seen from the maps? • Map with two dimensions • U-matrix (1st map): 40 vectors of 32 components, i.e. 40 positions (5x8) with 32 variables • Each position is represented by a hexagon • Hexagons surrounding a position represent the distance to other positions • Color of the position hexagon is an average of the colors of the distance hexagons • Component map (2nd map): same 40 positions with each estimated component • Two diagonal directions of wealth and education
6th in HDI 1 1st in HDI 52nd in HDI 40th in HDI 38th in HDI 21st in HDI 20th in HDI
Findings • Vung Tau is ranked first by HDI • Kohonen Map clustered it with Binh Duong, which is ranked 6th by HDI • Refinement of HDI ranking • Useful tool for mapping for example geographical areas like provinces into similar clusters onto a two-dimensional map on the basis of a larger number of socio-economic variables
Further research issues • Bootstrap confidence intervals for map parameters • “Cartoon Kohonen”: evolution of maps across several time periods • Kohonen maps and living standards more generally