Download
1 / 5
50 likes | 61 Views
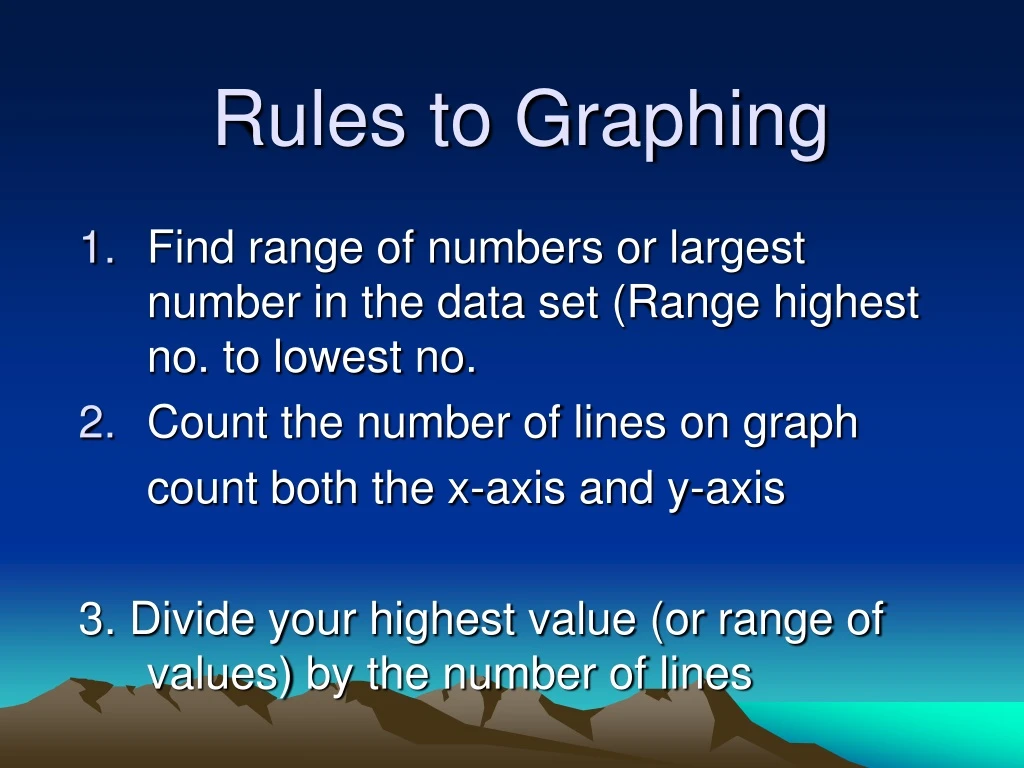
Rules to Graphing. Find range of numbers or largest number in the data set (Range highest no. to lowest no. Count the number of lines on graph count both the x-axis and y-axis 3. Divide your highest value (or range of values) by the number of lines. 4. Put your numbers on the axis

E N D
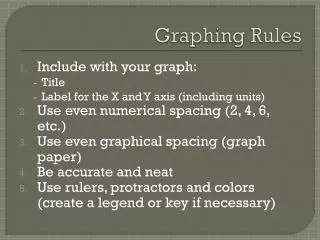
Rules to Graphing Find range of numbers or largest number in the data set (Range highest no. to lowest no. Count the number of lines on graph count both the x-axis and y-axis 3. Divide your highest value (or range of values) by the number of lines
4. Put your numbers on the axis • 5. Label your axis and title your graph • 6. Plot your points, connect plots with line • 7. Use Pencil and check over your graph
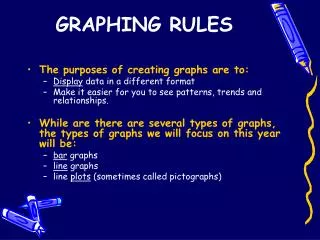
Types of Graphs • Line Graph (Most often used) • Bar Graph • Pie Chart
Types of graphs and their relationships • Direct Relationship • Indirect Relationship • Cyclic Relationship
No Relationship • No Relationship