Download

1 / 28
310 likes | 504 Views
Report Writing Course. ENGLISH LANGUAGE DEPARTMENT FACULTY OF LANGUAGES ADEN UNIVERSITY. Lecture 1. Points to be covered in this lecture: Formal and informal vocabulary Wrting a title page Describing tables and graphs. WRITING A TITLE PAGE. A Title Page

E N D
Report Writing Course ENGLISH LANGUAGE DEPARTMENT FACULTY OF LANGUAGES ADEN UNIVERSITY Lecture 1
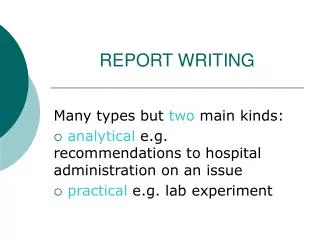
Points to be covered in this lecture: • Formal and informal vocabulary • Wrting a title page • Describing tables and graphs
A Title Page • The title page is presented ahead of the report. • The title page includes: • the title of the report (subtitle is optional) • its recipient • can include company contacts & logo • author, position or affiliation • date (usually month & year)
company logo • title • subtitle • date • author, position
Points to be discussed: • Types of tables and figures • Vocabulary used to describe graphs • Sentences used to describe graphs • The language of approximation
Types of tables and figures • Tables • Line graphs • Pie charts • Bar graphs • Flow charts • Organizational charts • A list of tables and figures must be included in the appendix.
Sentences used to describe graphs Types of Trend
The Language of Approximation Ordnumbers/statistics similar fractions 1 65 % about two-thirds of 2 28 % just over a quarter of 3 21 % about a fifth of 4 49 % just under a half of 5 74 % almost three – quarters of 6 33.333 % a third of 7 92 % most of 8 98,5 % almost all 9 19.98 % about a fifth of 10 26 % just over a quarter of 11 48.873 % almost a half of 12 74.25 % nearly three - quarters
Ordnumbers/statistics similar fractions 1,043 over a thousand 115 over a hundred 9 fewer than ten 2 a small number 4 a few 6/7 several 749,982 about three-quarters of a million 1,256,890,534 over 1.2 billion 21 101,997 about 100,000 248.112 a quarter of a million 1,695,193 about 1.7 million 24 97 just under a hundred