Download

1 / 18
180 likes | 333 Views
Impact of policy on urban growth. Gargi Chaudhuri Postdoctoral Fellow Resilience and Adaptive Management Group University of Alaska Anchorage. AAG Annual Meeting 2012: SLEUTH Symposium. Background. Simulate policy effects on urban growth via CA model

E N D
Impact of policy on urban growth GargiChaudhuri Postdoctoral Fellow Resilience and Adaptive Management Group University of Alaska Anchorage AAG Annual Meeting 2012: SLEUTH Symposium
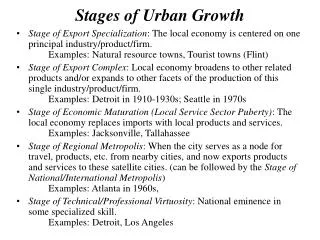
Background • Simulate policy effects on urban growth via CA model • Border represents a transitional zone, a region of flow and connection between two socio-economic systems • Policy is broadly defined as the combination of the political decisions, political history and situations which have directly affected the land use and socio-economic activities on the both sides of the border • Policy makers are the land managers and political leaders who affect how land is used at this very local level (Reid et al. 2006) • Background Objectives Study Area Methodology Data Results Conclusion
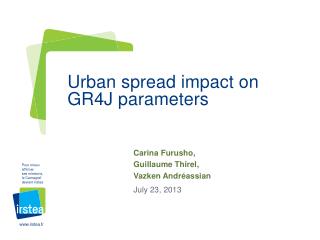
Objective • To find out the impact of policy on the pattern of urban growth in a trans-border region Courtesy: http://www.eea.europa.eu/articles/analysing-and-managing-urban-growth
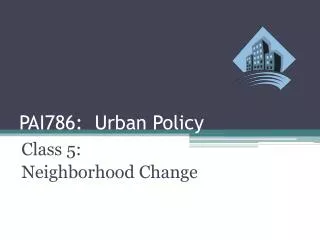
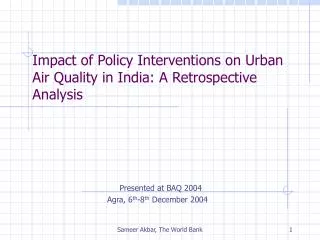
Gorizia, Italy and Nova Gorica, Slovenia International Border Italy Slovenia Gorizia, Italy and Nova Gorica, Slovenia Italy Slovenia International Border 4 Source: Google Maps
Nova Gorica, SLOVENIA Gorizia, ITALY
Historical Background • Initially under the Austro-Hungarian empire • 1915: Taken over by Italy • 1943 – 1945: Taken over by Germany • Completely destroyed and rebuilt during World War II • 1945 – 1947: Acquired by Yugoslavia • 1947: Old city of Gorizia was divided and western part of the city went back to Italy and eastern portion remained in Yugoslavia (Nova Gorica) • 1992: Became part of Slovenia after partition of Yugoslavia. • 2004: Slovenia became part of EU • Spatial Development Strategy of Slovenia (2004) implemented to foster agglomerated growth of the region • 2007: Became part of Eurozone
S 1985 1991 1998 1999 2004 1969 L Data: Scenario 1 E U Non-Weighted Roads T Weighted Roads H
S 1985 1991 1998 1969 1999 2004 L Data: Scenario 2 E U Non-Weighted Roads T Weighted Roads H
S 1985 1991 1998 1969 1999 2004 L Data: Scenario 3 E U Non-Weighted Roads T Weighted Roads H
Sc 1 Sc 2 Sc 3
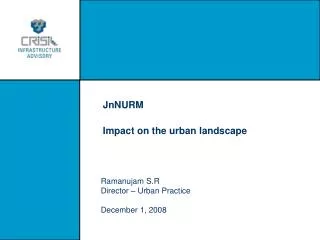
2040 Predicted Images 2040 Predicted Images with Weighted Road data 2040 Predicted Images with Non-weighted Road data
Scenario 1 Non-weighted road Weighted road Scenario 2 Non-weighted road Weighted road Scenario 3 Non-weighted road Weighted road
Validation • Kappa coefficient • Map comparison technique which is computed from a confusion matrix derived from cell-by-cell comparison of the observed map and the predicted map • Kappa = khisto * kloc • khisto • similarity of the quantitative results, based upon the total number of cells taken in by each class • kloc • compares the actual success space to the expected success rate relative to the maximum success space given that the total number of cells of each category does not change • < 0.00 = poor; 0.00 – 0.20 = slight; 0.21 – 0.40 = fair; 0.41 – 0.60 = moderate; 0.61 – 0.80 = substantial; 0.81 – 1.00 = almost perfect. (Landis and Koch, 1977)
Spatial Metrics • Number of patches determines the level of fragmentation • Perimeter-area fractal dimension (PAFRAC) determines the complexity of patch shape (1≤PAFRAC≤2) • The contagion index is an overall measure of the extent to which the landscape patches are dispersed or clumped
Conclusion • At the local level there are no significant differences between urban growth with weighted roads and non-weighted roads • Scenario 3 is more accurate than Scenario 2 and 1 • Nova Gorica still retains its dispersed urban growth pattern • Scenario 2 and 1 have almost same level of accuracy • Overall, the territorial cohesion hasn’t affected the urban growth of both the cities • EU and local integration policies haven’t been successful in fostering an integrated regional growth of the region
Thank you!! Acknowledgements University of California Transportation Center (UCTC) Dissertation Research Grant Dr. Andrea Faverratti, University of Trieste Dr. Federico Martellozzo, McGill University