Download
1 / 6
60 likes | 231 Views
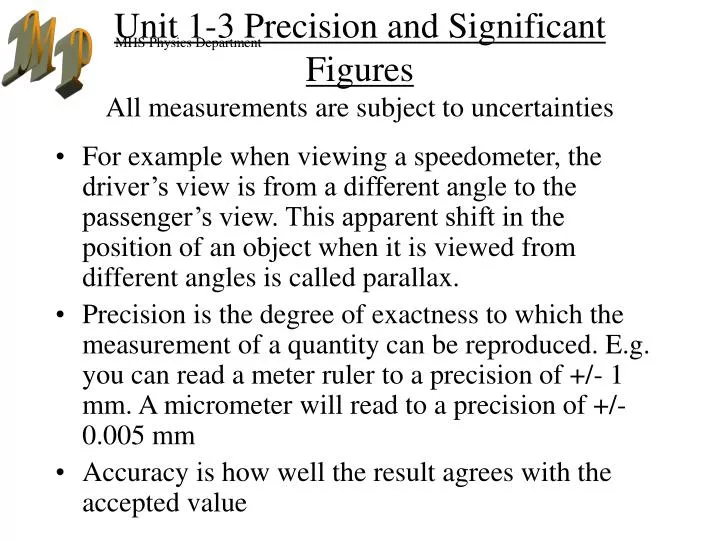
Unit 1-3 Precision and Significant Figures All measurements are subject to uncertainties.

E N D
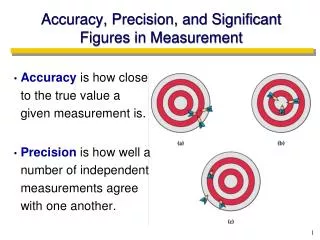
Unit 1-3 Precision and Significant FiguresAll measurements are subject to uncertainties • For example when viewing a speedometer, the driver’s view is from a different angle to the passenger’s view. This apparent shift in the position of an object when it is viewed from different angles is called parallax. • Precision is the degree of exactness to which the measurement of a quantity can be reproduced. E.g. you can read a meter ruler to a precision of +/- 1 mm. A micrometer will read to a precision of +/- 0.005 mm • Accuracy is how well the result agrees with the accepted value
Significant Figures • Significant figures or digits are all the digits that are certain plus a digit that estimates the smallest division of the measuring scale. • Rules: 1. Non zero digits are always significant • 2. All final zeros after the decimal point are significant • 3. Zeros between two other significant digits are always significant • 4. Zeros solely used for spacing the decimal point are not significant.
State the number of significant digits in each measurement • 2804 m • 2.84 m • 0.0029 m • 0.003068 m • 4.06 x 10⁵ m • 75 m • 75.00 mm • 0.007 060 kg
Operations using significant digits • The result of any mathematical operation with measurements can never be more precise than the least precise measurement • Add 24.686 m + 2.343 m + 3.21 m • Multiply 3.22 cm by 2.1 cm • Divide 36.5 m by 3.414 s • Multiply 0.64 m by 3.57 m
Graphs: Linear, Quadratic, and Inverse relationships • A linear relationship is a straight line graph and can be written in the form of y = mx + c • m is the slope which is equal to Δy/Δx or rise over run. • A quadratic relationship is a parabolic graph and can be written in the form of y = mx2 + c • An inverse relationship can be written in the form of y = 1/x + c