Download
1 / 20
200 likes | 214 Views
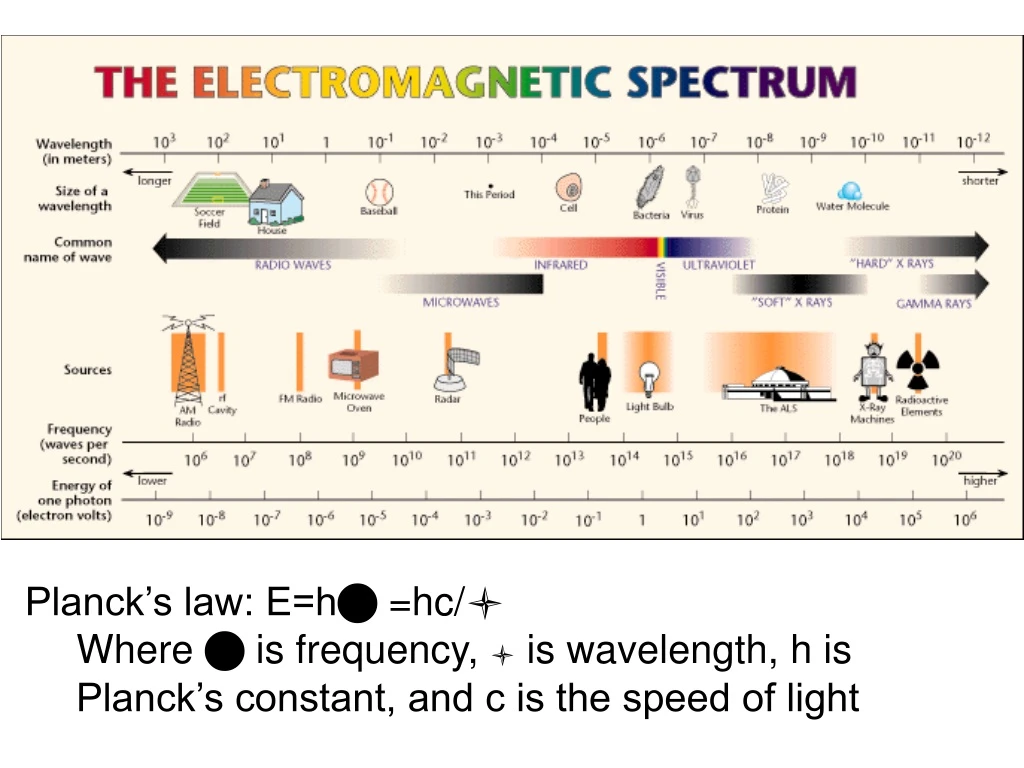
Planck’s law: E=h n =hc/ l Where n is frequency, l is wavelength, h is Planck’s constant, and c is the speed of light. Analytical Techniques for Minerals.

E N D
Planck’s law: E=hn =hc/l • Where n is frequency, l is wavelength, h is Planck’s constant, and c is the speed of light
Analytical Techniques for Minerals • XRD (X-ray diffraction) is one of the most powerful tools for mineral identification, structural/chemical refinement, and size determination – we will study it in detail (both lecture and lab). • Microscopy – Optical techniques are another very powerful tool for mineral identification, identification of physical/ chemical ‘history’ of minerals/rocks, and mineral association which we will also study in detail (both lecture and lab)
Analytical Techniques for Minerals • Spectroscopy – different methods of studying how different parts of the electromagnetic spectrum (of which visible light is a small part) are affected by minerals • Electron microscopy – look at techniques which utilize how electrons (shot through a sample of mineral) interact with minerals – imaging possible to very small sizes • Scanned-proximity probe microscopy techniques – look at forces between probe tip and sample to measure a property (height, optical absorption, magnetism, etc)
More analytical techniques • Sychrotron – Different techniques (many similar to spectroscopic techniques) that utilize particles accelerated to very high speeds and energies and how they interact with minerals • Magnetic – different techniques that utilize the magnetic properties of minerals • Size – techniques to determine the sizes of different minerals • Chemistry/isotopes – techniques to probe chemical and isotopic signatures in minerals
sample Transmittance spectroscopy Reflected spectroscopy Raman Spectroscopy Spectroscopy • Exactly how light is absorbed and reflected, transmitted, or refracted changes the info and is determined by different techniques
Light Source • Light shining on a sample can come from different places (in lab from a light, on a plane from a laser array, or from earth shining on Mars from a big laser) • Can ‘tune’ these to any wavelength or range of wavelengths IR image of Mars Olivine is purple
Causes of Absorption • Molecular or atomic orbitals absorb light, kicks e- from stable to excited state • Charge transfer or radiation (color centers) • Vibrational processes – a bond vibrates at a specific frequency only specific bonds can do absorb IR though (IR active)
Reflectance Spectroscopy • Non-destructive form of analysis, used to ‘see’ some of the chemistry, bonding • Spectroscopy is particularly good at detecting water and OH groups in minerals (especially in IR) • Good at differentiating between different clays because it detects OH groups well
Raman Spectroscopy • Another kind of spectroscopy which looks at a scattering effect and what that tells us about the chemistry, oxidation state, and relative proportions of different ions
Mössbauer Spectroscopy • Special effect, restricted to specific isotopes of certain elements which causes a very characteristic emission (after getting hit with a beam of gamma radiation) which is sensitive to the bonding environment of that isotope (only 57Co, 57Fe, 129I, 119Sn, 121Sb) • Generally used to study Fe – tells us about how Fe is bonded and it’s oxidation state
Nuclear Magnetic Resonance Spectroscopy (NMR) • NMR is useful for determining short-range cation ordering in minerals. • The NMR spectrometer can be tuned to examine the nucleus of mineralogical interest (e.g. aluminosilicates (27Al, 29Si, 23Na), oxides (17O, 25Mg, etc.), phosphates (31P), hydrous minerals (1H, 19F)). • NMR is particularly useful for cations that can not be distinguished by X-ray methods, such as Si/Al ordering in aluminosilicates
Electron Microscopy • What we can see using visible light is limited at the small end of spatial scales by the wavelength of light (hundreds of nanometers) • To image things smaller than this, need to use energy of smaller wavelengths • Because energy is inversely proportional to wavelength (E=hc/l), higher energy particles have smaller wavelengths and can image smaller things (e- are easy to generate and accelerate faster particle has more energy)
Secondary e- Electron Microscopy/ Spectroscopy • Interaction of electrons with a sample
e- penetration into a sample • Details dependent on mineral composition and accelerating voltage of e- beam, but for SEM applications:
SEM – what do we get? • Topography (surface picture) – commonly enhanced by ‘sputtering’ (coating) the sample with gold or carbon
TEM (+ HRSTEM) – What do we get? • ‘See’ smallest features with this – sub-nm! • Morphology – size, shape, arrangement of particles on scale of atomic diameters • Crystallographic information – from diffracted electrons, get arrangement and order of atoms as well as detection of atomic-scale defects • Compositional information – Chemical identity, including redox speciation (distinguish Fe2+ and Fe3+ for instance)
Electron Microprobe • Very similar to SEM and TEM in many respects, but utilizes ‘thick sections’ and a set of detectors which measure the emitted X-Rays from e- bombardment and excitation more accurately than the detectors used in SEM or TEM analyses • These detectors are wavelength dispersive spectrometry (WDS) detectors, there are usually an array of 3-5 which record over some range of wavelength much more accurately than the EDX detector available with SEM and TEM instruments
Synchrotrons • A synchrotron is a ring which uses magnets and electrodes to accelerate x-rays or light to nearly the speed of light • These extremely bright sources have widened the range of information which we can use traditional spectroscopy, diffraction, and even microscopy techniques for National Synchrotron Light Source (NSLS)
XANES and EXAFS • X-ray adsorption near-edge spectroscopy and Extended X-ray adsorption Fine Structure, commonly done with synchrotron radiation because the higher energy X-ray yields more precise data • X-ray techniques which look at the fine details of X-ray interactions with minerals • Sensitive to oxidation states and specific bonding environments
Atomic Force Microscopy (AFM) • Can be done in water or air (unlike SEM/TEM which requires a vacuum) • The probe is attached to a cantilever spring, in which the force ‘sensed’ is measured • Get topograpgic information at an atomic scale 2.5 nm2 rendering of a surface – what are the bumps?? Scanning tunneling microscopy (STM) is the precursor to this technique, and is still used to yield similar information