Download
1 / 50
500 likes | 610 Views
INDUSTRIAL INJURIES TO THE FOOT AND ANKLE. Michael J. Shereff, M.D. INCIDENCE. Bureau of Labor Statistics US Department of Labor 12 million work – related injuries occur each year = 20% of all injuries sustained in the United States. 7.2 million involve the musculoskeletal system. INCIDENCE.

E N D
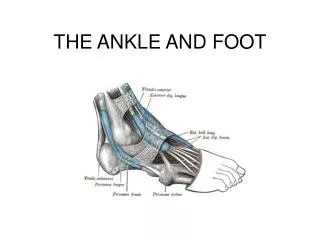
INDUSTRIAL INJURIES TO THE FOOT AND ANKLE Michael J. Shereff, M.D.
INCIDENCE Bureau of Labor Statistics US Department of Labor • 12 million work – related injuries occur each year = 20% of all injuries sustained in the United States. • 7.2 million involve the musculoskeletal system. • .
INCIDENCE • Foot and Ankle injuries = 9.9% of all injuries. • Most common age = 25 to 30years • Males:Females = 2-3:1 • Most common in technical,sales,and administrative support positions.
ANKLE • Service jobs = 25% • Manufacturing = 17% • Retail = 17% • Construction = 13%
FOOT • Manufacturing = 25% • Service & Retail = 18% • Construction = 15%
TOES • Decreasing Order of Frequency: • Manufacturing • Construction • Retail • Service
Construction Industry • 83% Foot and Ankle injuries occur in men. • Mean age = 34years. • More frequent in summer.
Construction Industry • Rate of return to work = 1.5 times higher for men than for women. • Rate of return to work = 20% less for each 10 year increase in age.
ETIOLOGYFoot and Ankle Injuries • Sprains/Strains = 42% • Contusions = 9% • Lacerations = 8% • Fractures = 6% • Other causes = 35%
ANKLE • Sprains & Strains = 70% • Fractures = 15% • Contusions = 5% • Cuts, punctures, burns & amputations = less common.
FOOT • Contusions = 30% • Fractures = 20% • Sprains & Strains = 15% • Cuts & Punctures = less common.
TOES • Fractures = 47% • Bruises = 23 % • Remaining causes = less common.
ETIOLOGY • Ontario Construction Industry • Puncture wounds=6.3% • Fractures=19.6% • Sprains=34.3%
Most Common Mechanism of Injury • Contact with an object • Falls • Exposure to a harmful force – vehicles & machinery.
Mechanism of Injury • Work – related injuries to the foot and ankle due to repetitive trauma are VERY UNCOMMON.
IMPACT • Median number of days missed from work = 5.
IMPACT • National Safety Council (U.S.) • 600 million dollars paid in compensation for work related injuries to the foot and ankle.
NATIONAL ACADEMY OF SOCIAL INSURANCE • Total costs to employers for Workers Compensation have increased. • Costs per covered employee has declined.
DECREASED COST PER EMPLOYEE • Increased workplace safety. • Medical care cost reforms. • Return to work programs = good cost containment. • Reduction of length of disability. • Tightening of eligibility for benefits.
SITE OF INJURY (USBLS 1999) • Ankle = 82,884 reported injuries = 51.63% • Foot = 59,782 reported injuries = 37.24% • Toes = 17,867 reported injuries = 11.13% • TOTAL = 160,533 reported injuries
SITE OF INJURY • American National Standards Institute • Sole=30% • Midfoot=23% • Toes=22%
SITE OF INJURY • Canadian Injury Survey • Ankle=32% • Metatarsal Area=31% • Toes=25% • Heel=6% • Sole=6%
SITE OF INJURY • Ontario Construction Industry • Ankle=50.1% • Metatarsal Area=32% • Toes=7.3% • Heel=5.4% • Sole=3.9%
PREDISPOSING FACTORS • Increased in young inexperienced workers • 55% < 30 years • 65% < 5 years experience
PREDISPOSING FACTORS • Most common on Mondays • Decreases rest of week • Increases before lunch • Increases late in afternoon • Least common = Friday AM
OCCUPATIONAL INJURIES • Phalangeal Area • Metatarsal Region • Sole • Heel • Ankle
PHALANGEAL AREA • Mechanism=direct blow • Phalangeal Fractures • Contusion-severe crush
FOREFOOT FRACTURES • 50% = hallux and 1st metatarsal • Most common sites = distal metatarsal and phalanx Great Toe • 25% = 5th ray • 25% = digits 2,3,&4.
FOREFOOT FRACTURESTREATMENT • External Fixation • Internal Fixation
METATARSAL REGIONMECHANISM • Direct = foot trapped or impacted beneath heavy object. • Indirect = plantar flexion & inversion injury
METATARSAL REGIONTYPES OF INJURIES • Contusion • Traumatic synovitis extensor tendons • Fracture metatarsal bones • Lis Franc fracture-dislocation • Compartment Syndrome
METATARSAL REGIONTREATMENT • Soft Tissue Injury: • Contusion • Traumatic Synovitis • Rx: Protected mobilization = Boot/Post-op Shoe & • Crutches –NWB –PWB-FWB
METATARSAL REGIONTREATMENT • METATARSAL FRACTURES • Nondisplaced = SLC-NWB • Displaced = closed or open reduction (+/-) internal fixation
METATARSAL REGIONTREATMENT • FRACTURE – DISLOCATION • Closed or open reduction (+/-) internal fixation.
COMPARTMENT SYNDROMES • Treatment = Fasciotomy
SOLE • Lacerations • Puncture Wounds • Treatment = Tetanus, Antibiotics, Debridement,
HEEL • Traumatic heel pad disruption – inserts. • Plantar fascia tear – Early =rest,NWB,ice Late = inserts • Fractures - nondisplaced = cast displaced = ORIF
ANKLE • #1 most common site of industrial trauma • Mechanism Direct = blunt trauma Indirect = inversion injury
ANKLE INJURIES • Sprain ligaments • Strain or rupture tendons • Fractures =less common
ANKLE SPRAIN • Tear LCL • Rx: Protected Mobilization
ANKLE FRACTURES • Lateral Malleolus • Medial Malleolus • Bimalleolar • Pilon Fractures • Rx: Non – displaced =SLC – NWB • Rx: Displaced = ORIF
INJURIES BY OCCUPATION • Aviators Astragalus • Fracture of the neck of the talus. • Sudden impact of foot against floorboard. • Rx: ORIF
FIREFIGHTERS,ROOFERS,& PAINTERS • Mechanism = Fall from height • Injury = Fracture calcaneus • Rx: ORIF
WELDERS • Mechanism = burns from metal fragments • Rx: Debridement and local wound care.
INDUSTRIAL CLEANING • Mechanism = scalding water burns • Rx: Debridement and local wound care.
PIPELINE WORK • Mechanism = Frostbite • Rx: Local wound care
ELECTRICAL WORK • Mechanism = high voltage burns • Rx: Debridement plastic surgical reconstruction.
INDUSTRIAL SHOEWEAR • Z41 Committee of ANSI (American National Safety Institute) • Mandates Safety Shoe standards.
INDUSTRIAL SHOEWEAR • Must protect from exposure to specific hazards on the job. • Constuction = safety toe shoes & puncture resistant soles. • Electrical = nonconductive soles.