Download
1 / 1
10 likes | 119 Views
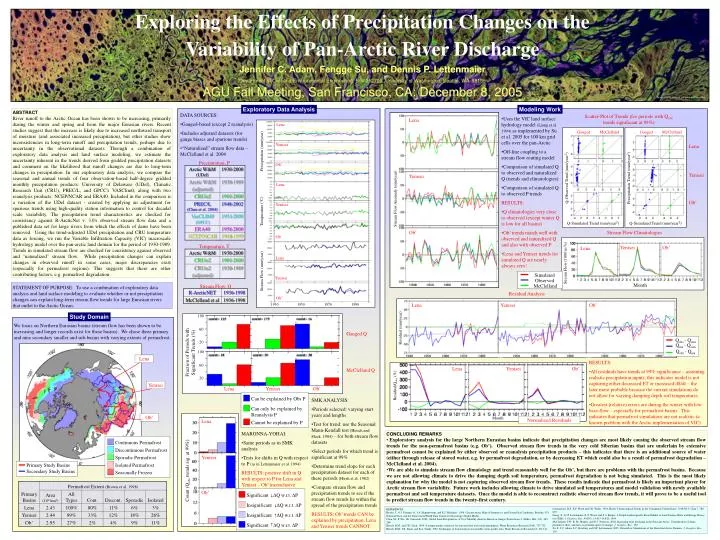
Gauged McClelland. Gauged McClelland. Lena. Lena. Precipitation (mm/year). Q-Observed Trend (mm/year 2 ). Precipitation Trend (mm/year 2 ). Lena. Yenisei. Stream Flow Anomaly (mm/year). Ob’. Yenisei. Yenisei. Lena. Temperature ( ° C). Ob’.

E N D
Gauged McClelland Gauged McClelland Lena Lena Precipitation (mm/year) Q-Observed Trend (mm/year2) Precipitation Trend (mm/year2) Lena Yenisei Stream Flow Anomaly (mm/year) Ob’ Yenisei Yenisei Lena Temperature (°C) Ob’ Yenisei Q-Simulated Trend (mm/year2) Q-Simulated Trend (mm/year2) Stream Flow (1000 m3/s) Ob’ Ob’ Yenisei Ob’ Lena Stream Flow (mm/year) Lena Simulated Observed Yenisei McClelland Month Ob’ 1930 1950 1970 1990 Residual (mm/year) Lena Yenisei Ob’ 100 Fraction of Periods with Significant Trends (%) 60 Gauged Q 20 100 Lena Qobs - Qsim Residual/Qobs (%) Qnat - Qsim Lena Yenisei Ob’ 60 Qobs - Qnat McClelland Q 20 Yenisei Lena Yenisei Ob’ Can be explained by Obs P Month Ob’ Can only be explained by Reanalysis P Lena Cannot be explained by P Continuous Permafrost Discontinuous Permafrost Count (Qobs trends sig. at 99%) Sporadic Permafrost Primary Study Basins Isolated Permafrost Yenisei Secondary Study Basins Seasonally Frozen Significant ΔQ w.r.t. ΔP Ob’ Insignificant ΔQ w.r.t. ΔP Insignificant ΔQ w.r.t. ΔP Significant ΔQ w.r.t. ΔP Exploring the Effects of Precipitation Changes on the Variability of Pan-Arctic River Discharge Jennifer C. Adam, Fengge Su, and Dennis P. Lettenmaier Department of Civil and Environmental Engineering, Box 352700, University of Washington, Seattle, WA 98195 AGU Fall Meeting, San Francisco, CA: December 8, 2005 Image: http://earthasart.gsfc.nasa.gov/lena.html Exploratory Data Analysis Modeling Work ABSTRACT River runoff to the Arctic Ocean has been shown to be increasing, primarily during the winter and spring and from the major Eurasian rivers. Recent studies suggest that the increase is likely due to increased northward transport of moisture (and associated increased precipitation), but other studies show inconsistencies in long-term runoff and precipitation trends, perhaps due to uncertainty in the observational datasets. Through a combination of exploratory data analysis and land surface modeling, we estimate the uncertainty inherent in the trends derived from gridded precipitation datasets and comment on the likelihood that runoff changes are due to long-term changes in precipitation. In our exploratory data analysis, we compare the seasonal and annual trends of four observation-based half-degree gridded monthly precipitation products: University of Delaware (UDel), Climatic Research Unit (CRU), PREC/L, and GPCC's VASClim0; along with two reanalysis products: NCEP/NCAR and ERA40. Included in the comparison is a variation of the UDel dataset - created by applying an adjustment for spurious trends using high-quality station information to control for decadal scale variability. The precipitation trend characteristics are checked for consistency against R-ArcticNet v. 3.0's observed stream flow data and a published data set for large rivers from which the effects of dams have been removed. Using the trend-adjusted UDel precipitation and CRU temperature data as forcing, we run the Variable Infiltration Capacity (VIC) macroscale hydrology model over the pan-arctic land domain for the period of 1930-1989. Trends in simulated stream flow are checked for consistency against observed and "naturalized" stream flow. While precipitation changes can explain changes in observed runoff in some cases, major discrepancies exist (especially for permafrost regions). This suggests that there are other contributing factors, e.g. permafrost degradation. • DATA SOURCES: • Gauged-based (except 2 reanalysis) • Includes adjusted datasets (for gauge biases and spurious trends) • “Naturalized” stream flow data – McClelland et al. 2004 Scatter-Plot of Trends (for periods with Qobs trends significant at 99%) • Uses the VIC land surface hydrology model (Liang et al. 1994) as implemented by Su et al. 2005 for 100 km grid cells over the pan-Arctic • Off-line coupling to a stream flow routing model • Comparison of simulated Q to observed and naturalized Q (trends and climatologies) • Comparison of simulated Q to observed P trends • RESULTS: • Q climatologies very close to observed (except winter Q is low for all basins) • Ob’ trends match well with observed and naturalized Q and also with observed P • Lena and Yenisei trends for simulated Q are nearly always zero! Precipitation, P Stream Flow Climatologies Temperature, T Stream Flow, Q STATEMENT OF PURPOSE: To use a combination of exploratory data analysis and land surface modeling to evaluate whether or not precipitation changes can explain long-term stream flow trends for large Eurasian rivers that outlet to the Arctic Ocean. Residual Analysis Study Domain We focus on Northern Eurasian basins (stream flow has been shown to be increasing and longer records exist for these basins). We chose three primary and nine secondary smaller and sub-basins with varying extents of permafrost. • RESULTS: • All residuals have trends at 99% significance – assuming realistic precipitation inputs, this indicates model is not capturing either decreased ET or increased dS/dt – the later more probable because the current simulations do not allow for varying damping depth soil temperatures • Greatest (relative) errors are during the winter with low base-flow – especially for permafrost basins. This indicates that permafrost simulations are not realistic (a known problem with the Arctic implementation of VIC) • SMK ANALYSIS: • Periods selected: varying start years and lengths • Test for trend: use the Seasonal Mann-Kendall test (Hirsch and Slack, 1984) – for both stream flow datasets • Select periods for which trend is significant at 99% • Determine trend slope for each precipitation dataset for each of these periods (Hirsh et al. 1982) • Compare stream flow and precipitation trends to see if the stream flow trends lie within the spread of the precipitation trends • RESULTS: Ob’ trends CAN be explained by precipitation, Lena and Yenisei trends CANNOT. Normalized Residuals • MARONNA-YOHAI: • Same periods as in SMK analysis • Tests for shifts in Q with respect to P (as in Lettenmaier et al. 1994) • RESULTS: positive shift in Q with respect to P for Lena and Yenisei – Ob’ inconclusive • CONCLUDING REMARKS • Exploratory analysis for the large Northern Eurasian basins indicate that precipitation changes are most likely causing the observed stream flow trends for the non-permafrost basins (e.g. Ob’). Observed stream flow trends in the very cold Siberian basins that are underlain by extensive permafrost cannot be explained by either observed or reanalysis precipitation products – this indicates that there is an additional source of water (either through release of stored water, e.g. by permafrost degradation, or by decreasing ET which could also be a result of permafrost degradation – McClelland et al. 2004). • We are able to simulate stream flow climatology and trend reasonably well for the Ob’, but there are problems with the permafrost basins. Because we are not allowing climate to drive the damping depth soil temperature, permafrost degradation is not being simulated. This is the most likely explanation for why the model is not capturing observed stream flow trends. These results indicate that permafrost is likely an important player for Arctic stream flow variability. Future work includes allowing climate to drive simulated soil temperatures and model validation with newly available permafrost and soil temperature datasets. Once the model is able to reconstruct realistic observed stream flow trends, it will prove to be a useful tool to predict stream flow trends in the twenty-first century. Lettenmaier, D.P., E.F. Wood and J.R. Wallis, 1994, Hydro-Climatological Trends in the Continental United States, 1948-88, J. Clim 7, 586-607. Liang, X., D. P. Lettenmaier, E. F. Wood, and S. J. Burges, A Simple hydrologically Based Model of Land Surface Water and Energy Fluxes for GSMs, J. Geophys. Res., 99(D7), 14,415-14,428, 1994. McClelland, J.W., R. M. Holmes, and B. J. Peterson, 2004, Increasing river discharge in the Eurasian Arctic: Consideration of dams, permafrost thaw, and fires as potential agents of change, J. Geophys. Res., 109. Su, F., J.C. Adam, L.C. Bowling, and D.P. Lettenmaier, 2005, Streamflow Simulations of the Terrestrial Arctic Domain , J. Geophys. Res., 110. REFERENCES Brown, J., O.J. Ferrians Jr., J.A. Heginbottom, and E.S. Melnikov. 1998. Circum-Arctic Map of Permafrost and Ground-Ice Conditions. Boulder, CO: National Snow and Ice Data Center/World Data Center for Glaciology. Digital Media. Chen, M., P. Xie, J.E. Janowiak, 2002, Global Land Precipitation: A 50-yr Monthly Analysis Based on Gauge Observations, J. Hydro. Met. 3(3), 249-266. Hirsch, R.M., and J.R. Slack, 1984, A nonparametric trend test for seasonal data with serial dependence, Water Resources Research 20(6), 727-732. Hirsch, R.M., J.R. Slack, and R.A. Smith, 1982, Techniques of trend analysis for monthly water quality data, Water Resources Research 18, 107-121.