Download
1 / 15
150 likes | 422 Views
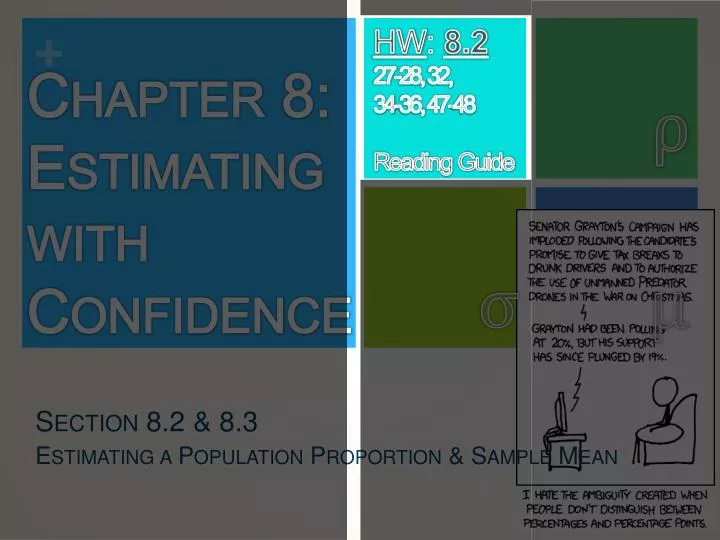
HW : 8.2 27-28, 32, 34-36, 47-48 Reading Guide. Chapter 8: Estimating with Confidence. ρ. σ. μ. Section 8.2 & 8.3 Estimating a Population Proportion & Sample Mean. Warm Up.

E N D
HW: 8.2 27-28, 32, 34-36, 47-48 Reading Guide Chapter 8: Estimating with Confidence ρ σ μ Section 8.2 & 8.3 Estimating a Population Proportion & Sample Mean
Warm Up • A consumer watchdog organization estimates the mean weight of 1-ounce “Fun-Size” candy bars to see if customers are getting full value for their money. A random sample of 25 bars is selected and weighed, and the organization reports that a 90% confidence interval for the true mean weight of the candy bars is 0.992 to 0.998 ounces. • (a) What is the point estimate from this sample? • (b) What is the margin of error? • (c) Interpret the 90% confidence interval 0.992 to 0.998 in the context of the problem. • (d) Interpret the confidence level of 90% in the context of the problem. use your notes!
CI Equation • Statistic + Margin of Error • Margin of Error = critical value * standard deviation The statistic and margin of error depends on whether we are dealing with a proportion or a mean!
Confidence Intervals: A Four-Step Process State:What parameter do you want to estimate, and at what confidence level? Plan:Identify the appropriate inference method. Check conditions. Do:If the conditions are met, perform calculations. Conclude:Interpret your interval in the context of the problem.
Beads Example • Before class Mr. Stuckey filled a non-transparent container with several thousand small plastic red and white beads. One student, Kara, selects an SRS of the beads with a cup and selects 107 red beads and 144 white beads. The class is concerned with the unknown proportion ρ of red beads. • In particular, they are asked to find a 95% confidence interval for ρ red beads
Conditions for Estimating ρ Check the conditions for estimating p from our sample. Random: The class took an SRS of 251 beads from the container. Normal: Both np and n(1 – p) must be greater than 10. Since we don’t know p, we check that The counts of successes (red beads) and failures (non-red) are both ≥ 10. Independent: Since the class sampled without replacement, they need to check the 10% condition. At least 10(251) = 2510 beads need to be in the population. The teacher reveals there are 3000 beads in the container, so the condition is satisfied. Since all three conditions are met, it is safe to construct a confidence interval.
Constructing a Confidence Interval for p Definition: When the standard deviation of a statistic is estimated from data, the results is called the standard error of the statistic.
Estimating a Population Proportion • Finding a Critical Value How do we find the critical value for our confidence interval? If the Normal condition is met, we can use a Normal curve. To find a level C confidence interval, we need to catch the central area C under the standard Normal curve. For example, to find a 95% confidence interval, we use a critical value of 2 based on the 68-95-99.7 rule. Using Table A or a calculator, we can get a more accurate critical value. Note, the critical value z* is actually 1.96 for a 95% confidence level.
Estimating a Population Proportion • Finding a Critical Value Use Table A to find the critical value z* for an 80% confidence interval. Assume that the Normal condition is met. Since we want to capture the central 80% of the standard Normal distribution, we leave out 20%, or 10% in each tail. Search Table A to find the point z* with area 0.1 to its left. The closest entry is z = – 1.28. So, the critical value z* for an 80% confidence interval is z* = 1.28.
One-Sample z Interval for a Population Proportion Once we find the critical value z*, our confidence interval for the population proportion p is
One-Sample z Interval for a Population Proportion Calculate and interpret a 90% confidence interval for the proportion of red beads in the container. Mr. Stuckey claims 50% of the beads are red. Use your interval to comment on this claim. • sample proportion = 107/251 = 0.426 • We checked the conditions earlier. • For a 90% confidence level, z* = 1.645 statistic ± (critical value) • (standard deviation of the statistic) We are 90% confident that the interval from 0.375 to 0.477 captures the actual proportion of red beads in the container. Since this interval gives a range of plausible values for p and since 0.5 is not contained in the interval, we have reason to doubt the claim.
Choosing the Sample Size In planning a study, we may want to choose a sample size that allows us to estimate a population proportion within a given margin of error. The margin of error (ME) in the confidence interval for p is • z* is the standard Normal critical value for the level of confidence we want. Sample Size for Desired Margin of Error To determine the sample size n that will yield a level C confidence interval for a population proportion p with a maximum margin of error ME, solve the following inequality for n:
Example: Customer Satisfaction In an SRS, the proportion of people who like HTC phones is 50%. Determine the sample size needed to estimate p within 0.03 with 95% confidence. • The critical value for 95% confidence is z* = 1.96. • Since the company president wants a margin of error of no more than 0.03, we need to solve the equation Multiply both sides by square root n and divide both sides by 0.03. We round up to 1068 respondents to ensure the margin of error is no more than 0.03 at 95% confidence. Square both sides. Substitute 0.5 for the sample proportion to find the largest ME possible.
HW: 8.2 27-28, 32, 34-36, 47-48