Download
1 / 14
140 likes | 254 Views
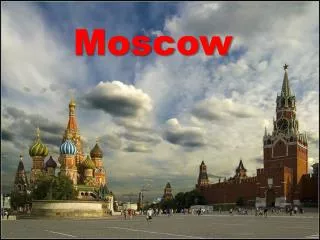
CIS Oil&Gas Agoria Carbon Energy Club Moscow, April 4 th , 2011. Johan Vanderplaetse VP CIS & Turkey. BRIC Gross Domestic Product (GDP) Per Capita. 2000-2010 GDP Per Capita CAGR. China. $12. India. Russia. $3. $15. 2010-2020 GDP Per Capita $ ∆ (000’s). $15. Brazil.

E N D
CIS Oil&Gas Agoria Carbon Energy ClubMoscow, April 4th, 2011 Johan Vanderplaetse VP CIS & Turkey
BRIC Gross Domestic Product (GDP) Per Capita 2000-2010 GDP Per Capita CAGR China $12 India Russia $3 $15 2010-2020 GDP Per Capita $ ∆ (000’s) $15 Brazil 2010 GDP Per Capita $(000’s) Russia Offers an Established Market and Steady Growth
Macroeconomic Indicators Russia Recent Economic Developments Investment Climate • Lessons from 2008 crisis has accelerated the efforts by the government to diversity its economy, with Skolkovo being a pet-project for President Medvedev • Fight against corruption continues, but stays until today mostly on paper • Still, Russia ranked world’s 5th top priority recipient economy for FDI for 2010-2012. The scheduled accession to the WTO in 2012 will further boost the economy • Russia plans also the set-up of a “special sovereign fund” to attract foreign capital • The government embarks on a massive new privatization plan: 600 state-controlled companies to be sold through 2015 • After a deep fall during the 2008 downturn, Russia’s economy recuperated very fast (driven by high oil prices) • But this also shows how dependent Russia remains from natural resources • Russia’s GDP growth at 4%, current account balance and fiscal deficit perform better then expected • Russia maintains enviable external account dynamics, with a robust current account surplus, limited foreign debt and high reserve holdings • US $1trn public-private investment plan over the long term will substantially modernise Russia’s transport, communications, electricityand utilities infrastructure
Investments – Power RUSSIA: ENERGY STRATEGY TILL 2030 IN THE PERIOD 2009-2030 RUSSIA IS PLANNED TO INVEST $1,500BIN POWER PRODUCTION AND SUPPLY 47.2 GW – 21% 62 GW – 14% 23.8 GW – 11% 129 GW – 29% 68.4 GW – 30% 142 GW – 32% 112 GW – 25% 85.5 GW – 38% Power generation in 2030, Total 445 GW Power generation in 2008, Total 224.9 GW By 2030 power generation capacity will almost double 220.1 GW 49% Capital expenditures in power production, $B Capital expenditures in power supply, $B 529$B 352$B TOTAL (2009-2030): 900$B TOTAL (2009-2030): 600$B 233$B 141$B 126$B 95$B Source: Ministry of Industry and Trade of the Russian Federation
Investments – Oil&GasRUSSIA: ENERGY STRATEGY TILL 2030 Gas: 590$B / 49% Oil: 625$B / 51% By 2030, 1,200$B is planned to be invested in Oil & Gas Russia (oil) – $300bn, 2010-2020 321$B Growth – 41.6% (2008-2030) 165$B 139$B 299$B Growth – 31.2% (2008-2030) 155$B 136$B Source: Ministry of Industry and Trade of the Russian Federation
Investments – Oil&Gas: Global majors Russia (oil) – $300bn, 2010-2020
Investments – Oil&Gas: Local majors Russia (oil) – $300bn, 2010-2020
Customer Segmentation • FOREIGN CONTROLLED / MANAGED: • INTERMEDIATE: Centralized: Decentralized: • LOCAL: “EASY” P Decision Making Process: Western P Decision Making Process P Decision Making Process: Russian Specifics “DIFFICULT”
Drivers & Dimensions Relevant For All Segments DRIVERS • Price • Quality of offering • product quality • address “pain” • Financing • ducroire • Implementation • Relations • proper • improper DIMENSIONS • Bottom-up : smaller deals • Bottom-up & Top-down: large deals Get your political story right “RANDOM 3”: you win “RANDOM 2” : you could win “RANDOM 1” : you loose TYPE OF COMPETITION - local competition - Western competition - Chinese competition
Business Model & go-to market • DIRECT MODEL For large customers, large deals or “western” companies • INDIRECT MODEL For smaller customer, smaller deals or “local” customers Multinationals tend to go direct, SME’s more indirect


![2011 ITRS Emerging Research Materials [ERM] April 10-13, 2011](https://cdn2.slideserve.com/5067644/2011-itrs-emerging-research-materials-erm-april-10-13-2011-dt.jpg)