Download
1 / 107
1.14k likes | 1.2k Views
2a. The Interstellar Medium 2.1 Introduction 2.2 Dust in galaxies Definitions of opacity, optical depth, colour excess MW extinction law (and LMC,SMC) Chemical composition 2.3 Overall Galactic extinction Mapping the dust distribution Extinction in other galaxies.

E N D
2a. The Interstellar Medium • 2.1 Introduction • 2.2 Dust in galaxies • Definitions of opacity, optical depth, colour excess • MW extinction law (and LMC,SMC) • Chemical composition • 2.3 Overall Galactic extinction • Mapping the dust distribution • Extinction in other galaxies
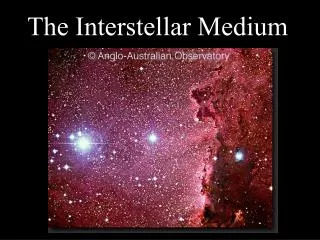
2b. The Interstellar Medium • 2.4 Observations of dust clouds • Dark clouds (& Bok globules, EGGs) • Reflection nebulae • 2.5 Interstellar gas • Atomic hydrogen (Lya, HI, local bubble) • Molecular gas • HII regions • Coronal gas • Stellar remnants - Planetary nebulae, Supernova remnants • Cosmic rays
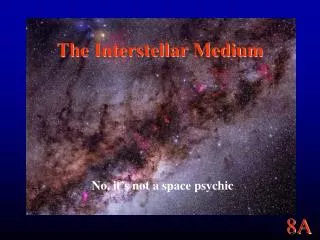
2. The Interstellar Medium • Sources: KKOPD 4.5, 15 (whole chapter); CO 12.1 (very brief); a lecture on dust by Keel; further reading BM 3.7 • 2.1 Introduction: • The Galaxy (and other galaxies) consist of stars, dust and gas (and DM) • stars – studied in detail in previous semester • interstellar medium (dust and gas) in this section • Why? The history review of history of determining shape and size of galaxies have shown the importance of dust absorption and scattering, and Rayleigh scattering in the determination of the true size of the Galaxy • distances to object in the Galaxy • mapping distances to other galaxies • determination of the total light, hence luminous matter • apart from being the ingredient in the formation of stars • Interstellar gas is filthy: compressed to density of ordinary air (factor of 1021) density of smoke would be such that objects would disappear in haze at distance of much less than 1m!!!
The effects of absorbing material in galaxies were recognized before the physical nature of galaxies became clear. A study by H.D. Curtis published in 1918 compared photographs of spirals in an obvious inclination sequence, showing that a band of obscuring material lies in the disk plane It became clear, especially from comparing with nearby edge-on systems such as NGC 891, that this layer is exactly what we see in our view of the Milky Way Lund panorama of MW (blue light) NGC 891 (red light)
Effects of Dust Important effects caused by scattering or absorption Dimming: scattering (redirection of light out of line of sight) absorption (photons transformed to heat) Reddening: as light travels through interstellar dust cloud bluer photons get scattered more strongly than red ones Heating: absorption is an important source of energy for the ISM: blue light heats dust re-emits in IR many galaxies emit large fractions of their light in the IR Dust has been observed in two guises:optical/UV absorption & far-IR emission With the recent advance in NIR and FIR astronomy, a lot is being learned about dust and grain properties, but also in mm-observations (molecules, especially CO)
Observations of the ISM • Opticalimaging and spectroscopy • Absorption of star light (dimming) and reddening • e.g. Dark clouds, patches in galaxies (horsehead nebulae, Coalsack) • Scattered light • e.g. Reflection Nebulae from gas around stars • Line emission from ionized gas (warm gas) • e.g. regions around hot young stars (HII regions), Planetary nebulae, SN remnants
Observations of the ISM – cont. • NIR and FIR observations of heated dust (e.g. IRAS, Spitzer, Herschel, WISE) • Radio, submm and mm • Cold gas • neutral gas (21cm transition of HI) • molecular gas (CO transition at 2.6mm), also masers in star forming region in radio (H2O) • From polarization - magnetic fields (information about grains) • X-ray: Hot gas (interstellar and intergalactic)
Phenomena caused by the interstellar medium (Table 15.2 in KKOPD)
Some recent highlights Left: M31 in CO (cold molecular gas) obtained with 800 hours of observation at the 30m IRAM mm telescope at the 2.6mm transition line (Astron. Astrophys. July 2006) Right: optical image for comparison ? M31 as seen with Spitzer, the mid-infrared (3.5 – 8 μm) Space Telescope launched 08/03)
Two highly obscured (AB = 22 mag) spiral galaxies discovered in GLIMPSE (the mid-infrared Legacy Survey) obtained with the Spitzer Space Telescope At l = 317.04 b = -0.50 l = 316,87 b = -0.60 At the heart of the GA?
2.2 Back to Dust in Galaxies • Dust is important in star-formation& induced SF through interacting and merging galaxies • Dust is being condensed in stars’ atmospheres and expelled by stellar winds • Dust is a useful first proxy for phases of the interstellar medium that are harder to trace, since cool gas and dust are coupled gravitationally through the drag of atom/grain collisions NGC 3314 - Hubble Heritage image AM1316-241
Definitions on extinction and optical thickness • Recall: distance modulus: (m – M) = 5 log r – 5 (with r in pc) • as distance r increases • brightness decreases as1/r2 • apparent magnitude increases • Except: absorbing (and/or light scattering) medium along the light path EXTINCTION • How does extinction depend on distance? • Take source emitting light Lo into solid angle ω • in the distance interval [r , r + dr], the extinction dL • is proportional - to flux L, • - the distance travelled in the medium • - and the absorbing material through • the opacity (Note: has dimension 1 / m) For : zero transparent infinity completely opaque Definition of optical thickness (dimensionless) Integrating from source (L = L0, and τ= 0)
Definitions of extinction and optical thickness Optical thickness is the depth of a medium in which the intensity of light of a given frequency is reduced to a factor of 1/e - roughly 2/3 of the light is absorbed within one optical thickness depth • L falls of exponentially with increasing optical thickness: • Note: empty space is transparent thus = 0 τ does not increase L remains const.
With a flux density F0 of the star at its surface R and F(r) the flux density at a distance r, we get: relating this to absolute magnitudes (thus for r =10 pc), we can determine the dist. modulus where A is the extinction in magnitudes For A ≥ 0 is the total extinction in magnitudes due to the entire medium between the star and observer. For constant opacity: a = 1.086 The change in magnitude due to extinction is approximately equal to the optical depth along the line of sight (since A ≈ r = τ)
Summary of definitions opacity [m-1]; characterizes absorbing medium (through reduction of light) For : zero transparent; infinity completely opaque optical thickness (dimensionless) depth of a medium in which the intensity of radiation of a given frequency is reduced by a factor of 1 / e; 2/3 of the light is being absorbed within one optical depth; ) L decreases exponentially - with increasing α (thickness of absorbing material Using flux ratios and the distance modulus we got a value of the total extinction A in magnitudes due to the entire medium between the star and observer For constant opacity: • For a unit distance the extinction in magnitudeA= 1.086 • The change in magnitude due to extinction is approximately equal to the optical depth dτ along the line of sight
Atmospheric Extinction(see lecture notes of first semester) The Earth’s atmosphere also causes extinction: The observed magnitude m depends on the location of the observer and the zenith distance of the object - determines the distance light has to travel through the atmosphere. - to compare different observations: compare the different pathes light has taken to reach you (your telescope and detector) - assume atmospheric layer of const. thickness Where X is the airmass. The magnitude increases (gets fainter) linearly with distance X Where k is the extinction coefficient The extinction coefficient can be determined by observing the same (standard) source several time during the night with a wide variety in zenith distances – usually well known for established Observatories.
First dust extinction measurements by Trumpler Trumpler 1930: first clear evidence of the existence of dust through the study of the space distribution of open star clusters: - absolute magnitudes of brightest stars: from spectra type distance r could be calculated from apparent magnitude via the distance modulus (m-M) or fitting of MS stars - he also determined the linear diameter D from the apparent angular diameter (D = d r) - more distant cluster appeared to be systematically larger than nearer ones Space is not completely transparent: star light is dimmed by some intervening material Trumpler obtained in the Galactic plane: apg = 0.70 mag/kpc (recall A = a r) Today: apg = 2mag/kpc thus 10mag extinction over a path of 5 kpc!!!
Colour Excess - but first: Recap: Photometry, magnitudes, filters -mv :visual magnitude (sensitive as in human eye, yellow at 5500Å) -mpg : photographic magnitude, more towards the blue -mbol : bolometric magnitude, integrated over all -BC : bolometric correction (BC = mbol - m or Mbol - M), [original: visual, to F5 ]
Colour Excess Another effect caused by the interstellar medium is reddening: blue light is scattered and absorbed more then red: the observed colour index (B-V) increases. E.g. the observed visual and blue magnitude of a star are: The observed colour index (same for apparent and intrinsic magnitudes) is: … is the intrinsic color of a star … is the colour excess Studies of the interstellar medium show that the colour excess E(B-V) is practically constant for stars: This makes it possible to determine the visual extinction if the colour excess is known
Colour Excess …is the intrinsic color of a star …is the colour excess Observed colour Measure magnitudes of stars of same spectral type in different filters to get wavelength dependence for wavelengths longer than B-band Colour excess Longer λ Extinction as a function of 1/ λ
Colour Excess …is the intrinsic color of a star …is the colour excess 2175Å bump Longer λ Milky Way Extinction curve Extinction as a function of 1/ λ
Colour Excess • Ratio of colour excess E(B-V) and Av is ~ constant for stars • R does not depend on properties of star or amount of dust • Useful for getting distances from photometry alone • Know intrinsic colour for particular spectral type • Measure observed colour
A(λ) 0 for very large λ (e.g. radio) • Measure to optical/NIR to ~ 2μm from earth • Shorter wavelengths (UV) from space • Interstellar extinction largest at shortest wavelengths • ~10% of optical in IR • Negligible in radio • Optically obscured objects can therefore be studied in the IR and in the radio. Extinction curve to shorter wavelengths for MW, LMC, SMC
Extinction • Reminder: Extinction caused by both scattering and absorption • Absorption: radiant energy transformed into heat, re-radiated at IR wavelengths corresponding to temperatures of dust particles reduced intensity and reddening of colour • Scattering: the direction of light changed as f(λ), leading to reduced intensity in the original direction of propagation (and change in colour) • Extinction caused by dust grains with D near wavelength of light • Gas can cause extinction but much lower scattering efficiency • scattering by total amount of gas negligible in interstellar space • (contrary to air molecules in Earth’s atmosphere atmospheric extinction)
Scattering • Assume that size a, refraction index m and number density n of particles is known • all particles are spheres with radius a • geometrical cross section is π a² • the true extinction cross section of particles: • where Qext is the extinction efficiency factor (or extinction coefficient) • Q is dimensionless • Q depends on composition of dust grains and wavelength • consider volume element dV with length dl and cross section dA normal to the direction of light propagation with particle density n • assume that particles don’t overshadow each other then there are particles in the volume element dV
Scattering cont. particles Cross section They will cover the fraction : The intensity within the path dl will then be reduced, proportional to fraction covered: Where is the ‘average’ particle density along the path. In magnitudes: Note: can be used to determine mean dust density if the other quantities are known (extinction and distance)
Scattering cont. • For spherical particles with radius a and refractive index m, the extinction efficiency factor Qext can be calculated exactly. • In general: (Absorbing and scattering efficiency factors) • Define with λ the wavelength of radiation, then • The exact expression is a series expansion in x that converges more slowly for larger values x. • For x«1 (particles much smaller than λ): • Rayleigh scattering • Elseparticles similar or larger than λ: • Mie scattering • Analogy: waves on the surface of a lake • If waves much smaller than an obstructing object (an island), they are simply blocked • If waves are much larger than object in their way (grain of sand), the waves pass by almost completely unaffected (Qλ ~ 0) Since
Scattering cont. Example: Extinction efficiency factor for refraction index m=1.5 and m=1.33 (water) for increasing particle size wrt wavelength For large x (x»1): Qext ≈ 2 Cross section is not just geometrical cross-section (Q = 1) as expected, because of diffraction of light at edges of particle • Extinction has wavelength dependence because cross-section for scattering depends on λ • Red light scattered less than blue light • Causes stars to look redder than effective temp. suggests
Chemical composition of dust grains • The UV bump at 2175Å = 4.6μm-1 • Predictions for A from Mie theory work well for longer wavelengths (IR to visible) • gives • but strong deviations in the UV around 2175Å - sharp rise as wavelength decreases • The bump gives hint about composition of dust: Graphite: well-ordered form of carbon, interacts strongly with light at 2175Å • Unclear how big graphite particles can get in ISM, but abundance of carbon and the resonance around 2175Å suggests graphite is a major component of ISM NIR observations (ISO) • Observations of dark absorption bands at 9.7 and 18 μm • from stretching of silicates in SiO and Si-O-Si bonds (energy levels tend to be grouped in closely spaced bands – broad features in the spectrum) • Existence of Silicate grains in dust clouds and diffuse ISM
NIR emission • Observations of unidentified infrared emission bands between 3 and 12μm • Due to vibrations in C-C and C-H bond (planar molecules with organic benzene ring-like structures) known as • Polycyclic Aromatic Hydrocarbons (PAHs) • Polarization • Light from interstellar dust tends to be slightly polarized; typically a few percent (amount depends on wavelength) • Dust particles can not be spherical but must be elongated • Dust particles must be somewhat aligned • Suggests existence of a (weak) magnetic field (difficult to measure as Earth and Solar B much stronger) • By studying the direction of polarization in various directions one can map the direction of the Galactic magnetic field (see next sheet) • The dust in the ISM seems composed of both graphic and silicate grains ranging from 0.25 μm to several Angstroms, the size of PAHs But note: the dominant component of the ISM is gas: HI, HII, H2
Magnetic field of MW Between 1-1.5kpc More distant stars: B is aligned with Gal. Plane between 100-200pc Nearer stars: Plumes of B rise tens of parsec above the Gal. Plane From Zeeman splitting of Doppler shifted 21 cm lines B ~ 10-10 – 10-9T (about 1 millionth of interplanetary field in solar system)
NIR emission • Observations of unidentified infrared emission bands between 3 and 12μm • Due to vibrations in C-C and C-H bond (planar molecules with organic benzene ring-like structures) known as • Polycyclic Aromatic Hydrocarbons (PAHs) • Polarization • Light from interstellar dust tends to be slightly polarized; typically a few percent (amount depends on wavelength) • Dust particles can not be spherical but must be elongated • Dust particles must be somewhat aligned • Suggests existence of a (weak) magnetic field (difficult to measure as Earth and Solar B much stronger) • By studying the direction of polarization in various directions one can map the direction of the Galactic magnetic field (see next sheet) • The dust in the ISM seems composed of both graphic and silicate grains ranging from 0.25 μm to several Angstroms, the size of PAHs But note: the dominant component of the ISM is gas: HI, HII, H2
The Milky Way’s ISM • Extinction curves for Milky Way, LMC, 30 Doradus and SMC • Increased extinction to shorter wavelengths • interrupted by local maximum - the so-called 2175-Angstrom bump 30 Doradus – Tarantula Nebula in LMC (HST image)
The interstellar medium (ISM) of the Milky Way • About 10% of the mass of the MW consists of interstellar gas • Interstellar space contains about 1 gas atom / cm3 • about 0.1% of that in dust grains (gas and dust distribution are strongly linked) • It is strongly concentrated towards the plane of the MW • What (little) we know about its grain properties comes from • the analysis of the extinction curve • - the normalized amount of extinction as a function of wavelength, • - derived from looking at pairs of stellar spectra with similar temperatures but different foreground extinctions. • The general extinction curve within each of the Milky Way, LMC, and SMC is fairly well defined • The overall increase to shorter wavelengths (approximately with absorption in magnitudes inversely proportional to wavelength) is interrupted by a local maximum • The so-called 2200-Angstrom bump
Main properties of interstellar gas and dust • Dust grains form in the atmospheres of stars of late spectral type (lower mass) and then expelled by radiation pressure into space. • Also form during star formation & possibly directly from atoms and molecules in IS clouds
2.3 Overall Galactic Dust Extinction (from galaxy counts to gas distribution to the DIRBE/COBE dust maps) • Images of edge-on galaxies & MW show that dust is concentrated in a fairly thin disk (~100pc for MW) • very high optical depth as viewed through the plane • IR observers quote values of AV=40 magnitudes toward the galactic center • Disk not very optically thick in the vertical direction (ZOA is relatively narrow) • Dust distribution is patchy: some areas at high & moderate galactic latitudes where we can see out (Baade’s window at (ℓ,b) = (1º, -3.9º) with 1.26 < AV < 2.79; Stanek 1996) • What is the radial and scale-height distribution of dust? • How does it relate to the spiral structure? • How does it affect the light from a galaxy's own stars and from background sources? Edge-on spiral NGC 891 (again) in the red
Recall: the sun is located near the central plane of the galactic dust layer • Dust in direction of GP is very large (higher towards GB than Gal. Anticentre) • Dust towards Galactic poles is low (0.1mag) This is apparent in the distribution of galaxies A band of about 20º width where hardly any galaxies are ZONE OF AVOIDANCE
The Effects of dust and stars in the Galaxy on external galaxies →smaller and fainter Part of Takahiro Nagayama’s PhD thesis 2004 (Nagoya University)
(1) Assume ‘homogenous’ dust layer that will give rise to a total extinction Δm magnitudes in vertical direction. Then the total Galactic extinction at Galactic latitude b will be: A galaxy with the apparent magnitude m0will be dimmer by that amount (2) Assume uniform distribution of galaxies in space. The number count per unit solid angle to apparent magnitude m will increase as: However, accounting for the Galactic foreground extinction, the observable number of galaxies will be reduced: Where does ‘NOT’ depend on Galactic latitude. So by counting galaxies at various latitudes b the extinction can be determined. Lick counts: Δmpg = 0.51mag, Determination in the blue by Sandage (1973):
Relation of dust with interstellar gas (valid for AV < 1 mag): • E(B – V) is proportional to column density NHIof interstellar hydrogen atom (HI or H2) • Bohlin et al. 1978; Kent et al. 1991: • Indicating constant dust to gas ratio : • Constancy down different lines of sight • fixed number and size of dust grains associated with given mass of hydrogen • - obviously only true as a first approximation • Near the Sun the number density is: • Along line of sight of length (distance) d in kpc (1 kpc = 3.086 x 10¹⁹ m):
DUST MAPS Burstein & Heiles 1982 - most of the sky lying outside the ZOA (|b| < 10º) • Method: • Count of number of galaxies in any zone to some limited magnitude; • Problem: cluster of galaxies compensate for extinction. • Extinction linked to neutral hydrogen from 21 cm column density • Problem: ionized and molecular gas cannot be detected. • Combining two methods accuracy of 0.01 in E(B-V) or 10%
HI column density map Hartmann et al. 1997; grid of 0.5º, supplemented with the lower resolution southern sky map constructed by Dickey & Lockman (1990). Log scale from 1019 to 2 1022 cm-2 Even newer HI data at: http://www.astro.uni-bonn.de/hisurvey/profile)
HI column density map Parkes Galactic All Sky Survey (GASS) mapped entire Southern sky visible from Australia (south of dec = 1 degree), 16 arcmin resolution Log scale from 1019 to 2 1022 cm-2 Even newer HI data from GASS at: http://www.astro.uni-bonn.de/hisurvey/profile
HI column density map Parkes Galactic All Sky Survey (GASS) mapped entire Southern sky visible from Australia (south of dec = 1 degree), 16 arcmin resolution Log scale from 1019 to 2 1022 cm-2 LSR -400 km/s and 500 km/s. McClure-Griffiths et al. 2009
https://www.sciencedaily.com/releases/2016/07/160725151144.htmhttps://www.sciencedaily.com/releases/2016/07/160725151144.htm Hodges-Kluck, Miller, Bregman. THE ROTATION OF THE HOT GAS AROUND THE MILKY WAY. The Astrophysical Journal, 2016; 822 (1): 21 DOI: 10.3847/0004-637X/822/1/21
DIRBE Dust map http://irsa.ipac.caltech.edu/applications/DUST/ NASA Extragalactic Database coordinate and extinction calculator Dust emission measured by COBE/DIRBE and IRAS/ISSA in the infrared Schlegel, Finkbeiner & Davis 1998 (Schlafly&Finkbeiner update 2011) More direct than Burnstein & Heiles (1982)
The distribution of cataloged galaxies with D ≥ 1.3’ (The diameter limit for which this Aitoff projection is complete) Comparison with DIRBE dust extinction maps: hardly any galaxies for AB = 1mag º º UGC in the north of δ≥ -17.5°(Nilson 1973); ESO Uppsala south of δ≤ -17.5°; MCG inbetween (VV &A 1963-1974)
Extinction in other galaxies (Galactic or internal extinction Ai) • Classical test for effects of dust traces back at least to Holmberg's 1958 paper • -using the surface-brightness versus inclination test • Fortransparentgalaxies • surface brightness should vary with apparent axial ratio a/b (same light concentrated in a smaller area) • For opaque galaxies we see only a thin skin (outer layer closest to us) • - the mean surface brightness will be constant with inclination. • Note: also affects isophotal diameters • Holmberg came to the reassuring conclusion that dust effects for global light were minor
Extinction in other galaxies Can be described by the following law: for a/b < 4.7 Where a and b are the major and minor axis. The maximum is invoked so that highly inclined galaxies do not get over-corrections. The slope depends on galaxy type later spirals having more dust) and strongly on the waveband (absorption diminishes with increasing λ) Typical values for the blue magnitudes (B) are (Sandage & Tammann 1981): BUT observationally, Valentijn (1990 Nature 346, 153) analyzed surface photometry of the entire ESO/Uppsala galaxy survey to conclude that galaxies are almost optically thick, out through the optical disk.
More modern result of the study of extinction in a sample of Sc galaxies Giovanelli, Haynes et al. 1994 Note: Disks have an intrinsic thickness and the relation between inclination i and axis ratio a/b cos i = b/a relation does break down: i = cos-1 [((b/a)²-q0²)/(1-q0²)]1/2 with q0 ~0.2 (intrinsic thickness of disk)