Download
1 / 53
530 likes | 538 Views
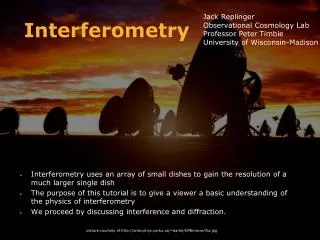
Interferometry with thermal atoms and separated beams. Jacques Vigué Laboratoire Collisions Agrégats Réactivité, IRSAMC Université P. Sabatier and CNRS UMR5589 Toulouse. The use of thermal atoms Various types of atom interferometers Applications to measurements.

E N D
Interferometry with thermal atoms and separated beams Jacques Vigué Laboratoire Collisions Agrégats Réactivité, IRSAMC Université P. Sabatier and CNRS UMR5589 Toulouse
The use of thermal atoms • Various types of atominterferometers • Applications to measurements
The use of thermal atoms The atom source issimple: usually a supersonicatomicbeam a verybright source and a narrowvelocity distribution. Large velocities 100 to 1000 m/s verysmall de Broglie wavelengthldB in the 10 to 100 picometers range. A verystrong collimation of the atomicbeamisusuallyneeded to separate the output beams of the interferometer. The output atomic flux issmall very efficient detectionwith a metastable state (He, Ne, Ar) or alkali atomswith a Langmuir-Taylor (hot-wire) detector. The verystrong collimation separates the atomicpathsinsidethe interferometer differentperturbations on the atomicpaths
Various types of atominterferometers • Young double-slitexperiment • Mach-Zehnderinterferometer • Ramsey-Bordé Interferometer • Talbot-Lau interferometer
Young double-slitexperiments O. Carnal and J. Mlynek, PRL 66, 2689 (1991) • metastableheliumatom, meanvelocity1800 m/s or 970m/s, • de Broglie wavelength56 pm or 103 pm • s1 = 1 mm, s2 = 2 mm, d = 8 mm; L = L’= 64 cm • Fringeperiod in detection plane: 4 or 8 mm
Convincingdemonstration but veryweaksignals Furtherworks • Chargedwireinterferometerequivalent to a Fresnel biprism (J. Mlynek et al., 1998) • Young double slitwith cold metastableneonatom (Shimizu 1992) ldB= 56 pm • ldB= 103 pm • ldB= 103 pm
Mach-Zehnderatominterferometers D.W. Keith, C.R. Ekstrom, Q.A. Turchette, and D.E. Pritchard, PRL 66, 2693 (1991) Na supersonicbeam v = 1000 m/s and Dv /v = 0.12 De Broglie wavelength: 16 pm. Diffraction by nanogratings : period 400 nm diffraction angle 40 mradbeamseparation 26 mm High sensitivity to vibrations servo-loop on the grating positions using a HeNeMach-Zehnderinterferometer
Fringe visibility V = (Imax-Imin)/(Imax+Imin) = 12% Mean signal intensity = 300 atoms/ second Fringe signal recorded by moving one of the threegratings • Large improvements in followingexperiments • Nanogratingsperiodreduced to 100 nm • diffraction angle 160 mradand beamseparation 100 mm • More intense atomicbeam • meansignal intensity up to 2x10⁵atoms/second • Bettergratings, alignment and vibration cancellation • visibility V up to 49% • Observation of signals due to Na2molecules
Mach-Zehnderatominterferometers D.M.Giltner, R.W. McGowan, and Siu Au Lee PRL 75, 2638 (1995) metastableneonatomv=1000 m/s de Broglie wavelength 19 pm laser diffraction in Bragg regime diffraction of order p=1, 2 or 3 laser wavelength640nm gratingperiod 320nm diffraction angle p x 28 mrad beamseparation p x 9 mm
Mach-Zehnderatominterferometers E.M. Rasel, M.K. Oberthaler, H. Batelaan, J. Schmiedmayer, and A. Zeilinger, PRL 75, 2633 (1995) metastable argon atom, velocity 850 m/s; de Broglie wavelength 12 pm, diffraction by laser at 810 nm in the “Kapitza-Dirac” regime light grating period = 405 nm diffraction angle 32 mradand beam separation 8 mm complementary fringe signals
Mach-Zehnderatominterferometers Our group in Toulouse, Appl. Phys. B 74, 489 (2002) ground state lithium atom v=1000 m/s, de Broglie wavelength 54 pm laser diffraction in the Bragg regime : laser wavelength 671 nm grating period 335 nm diffraction angle 160 mrad and maximum beam separation 100 mm 120 cm
p=1 Original features Bragg diffraction of order p = 1, 2 and 3 mean signal intensity = 3 x10⁴atoms/second excellent visibility V up to 84% for p=1 beam separation = p x 100 mm when the velocity is 1000 m/s operation with other carrier gases than argon (krypton, neon, helium, mixtures of noble gases) with velocity varying from 750 to 3300 m/s phase sensitivity 20 mrad/Sqrt(Hz) rigid structure small phase noise due to vibrations p=2 p=3
Mach-Zehnderatominterferometers J.P. Toennies group at MPI Göttingen (unpublished) ground state helium atom; very intense cold supersonic atomic beam with a temperature near 50 K ; velocity 720 m/s with a very narrow velocity distribution; very efficient electron impact ionization detector. de Broglie wavelength 140 pm; nanogratings 100 nm period diffraction angle 1.4 mrad and beam separation near 280 mm. fringe signal as a function of the electric field applied on one interferometer arm A. D. Cronin, J. Schmiedmayerand D.E. Pritchard, Rev. Mod. Phys. 81, 1051 (2009)
Ramsey-Bordé atom interferometers F. Riehle, Th. Kisters, A. Witte, J. Helmcke and Ch.J. Bordé, PRL 67, 177 (1991) Principle of this interferometer : diffraction by absorption of a single photon on a weakly authorized transition (3P1-1S0 calcium line at 657 nm) calcium atomic beam
Setup with a calcium atomic beam v = 700 m/s detection of the atomic fluorescence diffraction angle 22 mrad Detection of Sagnac effect by rotating the setup with an angular velocity W W =0 W =-0.09s-1 W =0 W =+0.09s-1 Frequency shift as a function of the angular velocity W W =0
Other Ramsey-Bordé interferometers Riehle and Helmcke’s team working with calcium Morinaga’s team PRA, 45, 4799 (1992) working with calcium Ertmer’s team Appl. Phys. B 59, 99 (1994) with Mg, either laser-trapped atoms or in a thermal atomic beam. Ch.J. Bordé et al. Phys .Lett. A 188, 187 (1994) with iodine molecule I2 Ch. Lisdat, M. Frank, H. Knöckel, M.-L. Almazor, and E. Tiemann, Eur. Phys. J. D, 12, 235 (2000) with potassium molecule K2
Talbot-Lau interferometers J.F. Clauser and Shifang Li, PRA 49 R2213 (1994) and 50, 2430 (1994) Principle: the Talbot effect i.e. the self imaging property of a grating in near-field diffraction. The atom paths are not truly separated. This type of interferometer is very interesting with heavy molecules because of their very small de Broglie wavelength (Markus ARNDT experiments)
Main applications of separated beam interferometers with thermal atoms Electric polarizability of atoms Gyrometer by Sagnac effect (Pritchard, Kasevich) Index of refraction of gases for atom waves (Pritchard, our research group) Atom wave decoherence by spontaneous emission of a photon (Mlynek, Pritchard) He-McKellar-Wilkens geometric phase Van der Waals atom-surface interaction (Cronin, our research group) Phase-modulation of matter waves
Principle of the measurements A weak perturbation U(r) is applied B C A D Advance (or delay) of the perturbed wavefront = ldBDf/(2p) obtained on a macroscopic distance L WithldB= 10 - 100 picometers, Df= milliradians, L = 100 mm, minimum detectable relative variation of velocity Dv/v =10-12 extreme sensitivity of measurements by atom interferometry
Electric polarizability a of atoms Spectroscopy measures the difference of the polarizabilities of different internal states but the polarizability itself can be measured only by a mechanical effect. Traditional technique : measurement of the deflection of an atomic beam by an electric field gradient dE/dz. Atom interferometry: phase shift induced by an electric field E applied on one interferometer arm.
First experiment with sodium C.R. Ekstrom, J. Schmiedmayer, M.S. Chapman, T.R. Hammond, and D.E. Pritchard, PRA 51, 3883 (1995) Measured phase shift Septum Sodium atom electric polarizability
Our experiment with lithium A. Miffre, M. Jacquey, M. Büchner, G. Trénec, and J. V., PRA 73, 011603R (2006) capacitor with flat electrodes • analytic equation for the electric field 100 mm wide insulating gaps the unknown potential in the gaps limits the knowledge of the integral of E2. Li= (24.34 0.16) 10 -30 m3 = 164.27 1.1 u.a. Best theoretical value Li= 164.0740(5) a.u M. Puchalski et al, PRA A 84, 052518 (2011)
Other measurements of the polarizability by atom interferometry Using an electric field gradient and no septum, Cronin and co-workers have measured the absolute value and the ratio of the polarizabilities of several alkali atoms Na, K, Rb, Cs with very small relative uncertainties 1-2x10⁻³. Perspective The sensitivity to the atom velocity can be suppressed by pulsing the electric field while the atoms are in the capacitor geometric phase shift of the scalar Bohm-Aharonov type
He-McKellar-Wilkens geometric phase Geometric phases: the Aharonov-Bohm phase (1959) I The magneticfieldvanishes on the electronpaths and the Lorentz force vanishestoo but thereis a phase shift given by This a geometric phase, detectableonly by interferometty, independent of the electronvelocity, but changingsignwith the direction of propagation.
First generalization: fromAharonov-Bohm to Aharonov-Casher Aharonov-Casher (1984) Exchange the roles of the electric charge e and magneticdipoleµ E e Aharonov-Bohm (1959) E e µ µ µ e µ e µ e µ In the electron frame moving with a velocity v
Second generalization by Maxwell duality Aharonov-Casher (1984) E e E e µ µ e µ e He-McKellar-Wilkens 1993 B Maxwell duality : exchange of the fieldsE B exchange of the electric charge e and magneticcharge g e g exchange of the electricdipoled and magneticdipoleµµ d g B g d d g d g
He-McKellar-Wilkens phase B E d E d atomic paths I B g B g d d g 48 mm d g maximum value HMW= 41 mrad i.e. 6 ×10⁻³fringe !
Results: accuratemeasurements and geometriccharacter of the He-McKellar-Wilkens phase Usingopticalpumping of the lithium beam 3 measurements for 3 meanvelocities vm= 744 m/s, vm= 1062 m/s and vm= 1520 m/s • velocitydependence if • HMW 1/v • = 0 : geometricphase • = 1 : dynamical phase • = 2 : inertial phase
Phase modulation of matter waves A time-dependent index of refraction applied on a length L induces a time-dependent phase shift t = propagation time from modulation to detection Production of side-bands to the atomic wave with energies equal to Amplitude of the pth side-band
A time-dependent electric field E(t) produces Experiments with the same modulation frequency of EA(t) and EB(t) or with two different frequencies. Detector response time equal to 1 millisecond only low frequency modulations can be detected
Experiments with only one frequency of modulation w Modulated detector signal at the harmonics pw. Phase shift
Experiments EA(t) and EB(t) modulated with two different frequencies : beats of matter waves Modulation of EA(t) at wA and EB(t)at wBand detection of the modulation of the signal at the difference frequency (wA - wB) and its harmonics (wA - wB) /(2p) = 13 Hz The observed beats are due to the non-linear character of quantum measurement.
Concludingremarks Atominterferometerswith thermal atomswere the first to provide the possibility of applyingdifferent perturbations on the twoatomicpaths severalpioneeringworks. Theseexperiments have demonstrated the extremesensitivity of atominterferometry. However, thermal atoms are not the best choice for high-precisionexperiments. Considerablyhigher performances are or willsoonbeavailablewith ultra-cold or BEC atom sources.
Atom interferometry in Toulouse Matthias Büchner Alexandre Gauguet Gérard Trénec Baptiste Allard PhD students since 1996 Caroline ChampenoisJonathan Gillot RémiDelhuille Gilles Dolfo Alain Miffre Boris Decamps Marion JacqueyJulien Alibert Steven LepoutreMaximeBordoux Post-docs Bruno Viaris de LesegnoHaikelJelassi
Drawing by Charles Addams, 1940, 1968, The New Yorker Magazine. Inc. cité par A.G. Klein dansPhysica 137B (1986) p230-234
Electric fieldproportional to the voltage V up to 800 V, Emax= 0.7 MV/m • Magneticfieldproportionalto the coilcurrent I up to 40 A, Bmax= 2.24 ×10⁻⁴ T • HMWproportional to the product VI with a maximum value • HMW ≈ = 41 mrad or 6 ×10⁻³fringe! • Manydifficulties: • phase drifts near 0.2 mrad/s • residual Stark phase shifts due to the inhomogeneity of the electricfield • residual Zeeman phase shifts due to the inhomogeneity of the magneticfield
First measurement Most systematiceffects have the same value for opposite values of the magneticfield we combine phase shifts measuredwith opposite values of the current in the coil Measuredslopefinal(V,I) /VI = -(1.680.07) ×10-6 rad/VA TheoreticalslopeHMW (V,I) /VI = -(1.280.03) ×10-6 rad/VA
Optical pumping of the lithium atomicbeam Ground state of7Li: 2S1/2 with a nuclear spin I= 3/2 2 levels of total angular momentum F=1 and F=2 Optical pumping on D1 line withtwocircularlypolarized lasers Efficiency of the optical pumpingnear 95%
Second measurementwithopticalpumping of the lithium atom in the F=2, mF = +2 or -2 sub-level Twomeasurements for the twolevelsmF = +2 or -2 EB(V,I,mF) EB(V,I,mF) contribution of the Aharonov-Casher phase HMW(V,I,mF) isindependent of mFwhileAC(V,I,mF) changes signwithmF
Measurement of the refractive index of gases for matterwaves gas B A C S D without gas I = | ABC+ ADC|2 = I0 [1+ V cos ] withgas I = | ABC tgaz e i gas+ ADC|2 = I’0 [1+ V’ cos(+gas) ] withI’0 V’ = t gasI0 V We can measure Re (n-1 ) = gas/ (k L) Im (n-1) = ln (tgas) /( k L)
gas 300 m wide slits 60 mm 6.5 mm 6.5 mm gas line septum entrance slit The gas cell
Experimental data Pgas 2 10-4 mbar Io = 12 000 c/s V= 44 % gaz 700 mrad Pgas < 10-6 mbar Io = 20 000 c/s V= 66 %
P gaz = 0.9 10-4 mbar tgaz= 0.66 ± 0.01 gaz=260 ± 24 mrad P gaz = 2.14 10-4 mbar tgaz= 0.39 ± 0.01 gaz = 707± 55 mrad P gaz = 4.36 10-4 mbar tgaz= 0.18 ± 0.007 gaz = 1243 ± 117 mrad
(n-1) is a linear function of the gas density Pgas varies between 310 -5 mbar and 510 -4 mbar Xenon
Index of refraction for lithium atoms with a mean velocity u = 1075 m/s corresponding to soit dB= 54 pm
Glory oscillations of the index of refraction Calculations of the forward scattering amplitude in the sodium-argon case (C. Champenois, thesis 1999) ratio r r = Re[f(kr)]/Im[f(kr)] = Re(n-1)/Im(n-1)
Comparison with total collision cross section measurements Xenon Transmitted flux / incident flux = exp [-2Im (n-1)kL] = exp[-N0 L] Experimental results due to L. Wharton and co-workers in 1972 our data points
Glory oscillations Re(n-1) and Im(n-1) as a function of the velocity u Re (n-1)/N0 et Im (n-1) /N0 u-7/5 Re(n-1) cos(2l) et Im(n-1) sin(2l) phase quadrature
Comparison of experimental and theoretical values of =Re(n-1)/Im(n-1) Xenon The mean value of r value is govened by the power of the leading term of the long range potential r -6r = 0.726 r -8 r = 0.482 The number of glory oscillations depends on the number of bound states in the attractive well, but this value is strongly reduced by thermal averaging due to target gas motion. ab initio pot. curve: S. Patil D. Cvetko Semi-empirical pot. curve L. Wharton
Rotation by Sagnac effect • Already described the Ramsey-Bordé interferometer • D.E. Pritchard’s team, PRL 78, 760 (1997) • T.L. Gustavson, P. Bouyer and M.A. Kasevich, PRL 78, 2046 (1997) Mach-Zehnder using Raman diffraction: the exit beams are in different internal states selective detection by laser 192 cm