Download

1 / 27
270 likes | 275 Views
Learn about GDP and its importance in measuring a nation's wealth, the difference between nominal and real GDP, and factors that contribute to economic well-being. Explore the significance of productivity, costs of production, human capital, management, physical capital, and technology. Discover how GDP per capita varies among different countries.

E N D
Output: GDP Measuring a Nation’s Wealth
GDP & GNP • GDP = gross Domestic Product • Measures productivity within a nations boundaries • GNP = Gross National Product • Measures productivity of a nation’s citizens
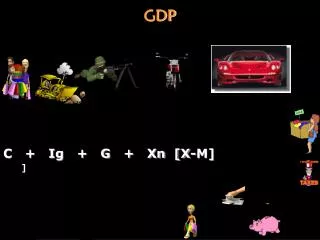
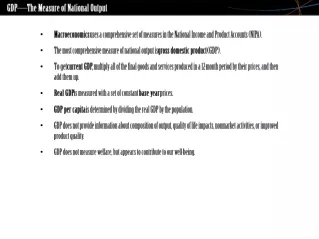
GDP • A MONETARY measurement of all FINAL good and services produced IN A NATION’s BORDERS in a GIVEN PERIOD OF TIME
GDP ignores things produced but not for sale Child Care Meals Auto Care GDP Does not measure Value of leisure time Illegal productivity Secondary sales
Intermediate Goods • “Ingredients” or “Parts” used in production • Only counts the FINAL Good • Avoids Double Counting
Two Categories of Goods • Durable Goods • Nondurable Goods
Nominal GDP does not measure price changes in production year to year Ignores Inflation Changes in Real GDP does reflect true production changes year to year Changes in Real GDP per capita reflect a nation’s Standard of Living
GDP not adjusted for inflation 2001 1st qrt. = $ 10,025 Billion 2001 3rd qrt. = $10,096 Billion GDP adjusted for inflation Real GDP 2001 1st qrt. = $ 9,882 Bill 2001 3rd qrt. = $ 9,835 Bill GDP: Nominal vs Real
Per Capita • Real GDP divided by population • Shows average income per person • Does NOT show unequal distribution of wealth (Lorenz Curve does that)
Real GDP Per Capita – 2013: World Average = 12,700 Denmark = 57,998 UK = 39,048 Germany = 43,952 Russia = 14,973 Rwanda = 723 China = 6,569 • USA = 52,839 • Canada = 51,871 • Mexico = 11,224 http://knoema.com/pjeqzh/gdp-per-capita-by-country-1980-2012
GDP NOT meant to measure economic well-being between different countries! • Economic activities between nations differ • Ignoring things not going through a market (such as Barter), many things in other nations are not included in their GDP! • Ex: Africa’s GDP is about $250 per year!
Real GDP is one factor is evaluating a nations well-being: but mainly when comparing year to year with itself! If Real GDP increases faster than population, then the nation, as a whole, is getting richer!
Real GDP Growth • Between Rome (circa 100 AD) and the dawn of the Industrial Revolution (circa 1800 AD) livings standards were relatively unchanged! • America, between 1900 and 2000, has had its standard of living increase by a factor of more than 7! (Americans in 1900 consumed one seventh of what we consume today!)
The Key to Growth • Productivity growth is (almost) everything in the long run! • Only rising productivity can raise the standard of living
Costs change as Production Levels Change • Costs vary as level and speed of production change • Overhead costs change • Fixed Costs are easy to plan and budget • Variable Costs are difficult to plan and budget
More water in the pot does not allow the growth of an infinite number of plants • More workers in a plant increases the cost of producing an additional unit • More inputs, higher costs
Law of Diminishing Returns • As more and more variable resources are added to a fixed amount of other resources, the additional (Marginal) amount produced eventually diminishes • The variables crowd the fixed
HOWEVER… • If my current resources can produce at higher levels, I have increased output without increasing inputs – that is a Productivity increase! (don’t increase inputs) • If I spread my costs out among my outputs, having a higher output with a constant total cost decreases my per unit cost! Example: If I have 4 workers at $50/day (use ceteris paribus) I have a total cost of $ 200/day If they produce 10 units of output per day, my per unit output cost is $ 20 each. NOW… what if…
My 4 workers receive training (I have increased the quality of my labor) As a result, my workers (at $50/day cost) are able to make more than 10 units a day… They now make 15 units per day!!! A total cost of $ 200 spread out over 15 units of output (instead of the old 10) lowers my per unit cost of production from $20 per unit to $13.34 per unit!!! THUS…
We have MORE outputs available (GDP rises) • The lower costs of production increase profits! • With the extra profits I can expand my company and MAKE MORE!!! (increasing output/GDP even more)
Human Capital • Quality of Human Resources • Education • Training • Skilled workers I is smart
Improving Management • Focus on the customer • Focus on Quality Control • Reduce waste and inefficiency • Create a shared vision
Management • Good management creates incentives and motivation to increase productivity • Effects efficiency of resource allocation
Physical Capital • Quantity and Quality of Capital Resources • New capital increases productivity • Capitalism system offers incentives to increase Capital
Technology • Technological Change • Innovations contribute to efficiency of production, thus increasing productivity • Ford’s assembly line, Computers, et cetera
Other Major contributors to a nation’s well-being: Reduction of poverty Increase of leisure time Financing: • Health Care • Education • Environmental Improvement • The Arts