Download
1 / 44
490 likes | 858 Views
Chapter 9: Phase Diagrams for Metallic Systems. ISSUES TO ADDRESS. • When we combine two elements... what equilibrium state do we get?. • In particular, if we specify... --a composition (e.g., wt% Cu - wt% Ni), and --a temperature ( T ). then...

E N D
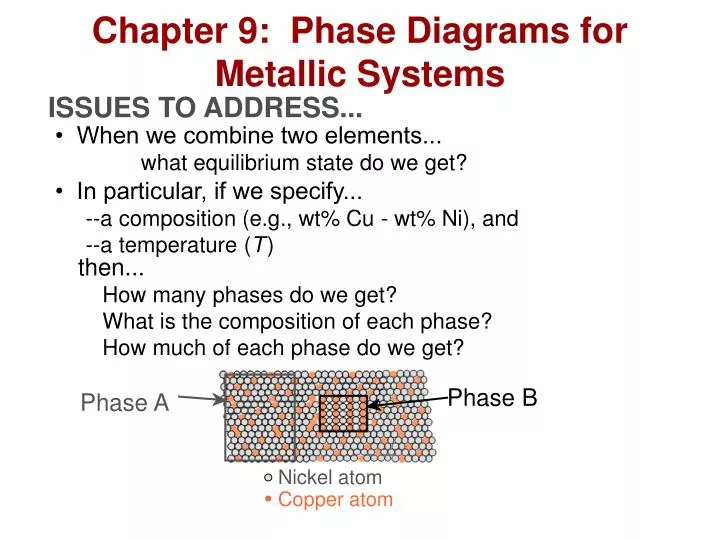
Chapter 9: Phase Diagrams for Metallic Systems ISSUES TO ADDRESS... • When we combine two elements... what equilibrium state do we get? • In particular, if we specify... --a composition (e.g., wt% Cu - wt% Ni), and --a temperature (T) then... How many phases do we get? What is the composition of each phase? How much of each phase do we get? Phase B Phase A Nickel atom Copper atom
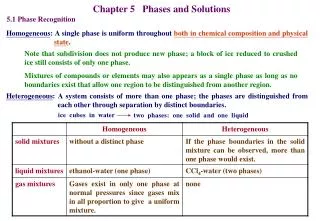
Sucrose/Water Phase Diagram 10 0 Solubility L Limit 8 0 (liquid) 6 0 + L Temperature (°C) S (liquid solution 4 0 i.e., syrup) (solid 20 sugar) 0 20 40 60 80 100 65 Co =Composition (wt% sugar) Sugar Water Pure Pure Phase Equilibria: Solubility Limit • Introduction • Solutions – solid solutions, single phase • Mixtures – more than one phase • Solubility Limit: Max concentration for which only a single phase solution occurs. Question: What is the solubility limit at 20°C? Answer: 65 wt% sugar. If Co < 65 wt% sugar: syrup If Co > 65 wt% sugar: syrup + sugar.
Components and Phases • Components: The elements or compounds which are present in the mixture (e.g., Al and Cu) • Phases: The physically and chemically distinct material regions that result (e.g., a and b). Aluminum- Copper Alloy b (lighter phase) a (darker phase)
B (100°C,70) 1 phase D (100°C,90) 2 phases 100 L 80 (liquid) + 60 L water- sugar system S Temperature (°C) ( liquid solution (solid 40 i.e., syrup) sugar) A (20°C,70) 2 phases 20 0 0 20 40 60 70 80 100 Co =Composition (wt% sugar) Effect of T & Composition (Co) path A to B. • Changing T can change # of phases: • Changing Co can change # of phases: path B to D.
Phase Equilibria Simple solution system (e.g., Ni-Cu solution) • Both have the same crystal structure (FCC) and have similar electronegativities and atomic radii (W. Hume – Rothery rules) suggesting high mutual solubility. • Ni and Cu are totally miscible in all proportions.
T(°C) • 2 phases: 1600 L (liquid) 1500 L (liquid) a (FCC solid solution) • 3 phase fields: 1400 L a liquidus + 1300 a L + L solidus a a 1200 (FCC solid 1100 solution) 1000 wt% Ni 0 20 40 60 80 100 Phase Diagrams • Indicate phases as function of T, Co, and P. • For this course: -binary systems: just 2 components. -independent variables: T and Co (P = 1 atm is almost always used). •Phase Diagram for Cu-Ni system
T(°C) 1600 L (liquid) • Examples: 1500 a 1 phase: Cu-Ni phase diagram liquidus A(1100°C, 60): B (1250°C, 35): (1250°C,35) 1400 solidus a 2 phases: L + a a + 1300 L B (FCC solid 1200 solution) 1100 A(1100°C,60) 1000 wt% Ni 0 20 40 60 80 100 Phase Diagrams:# and types of phases • Rule 1: If we know T and Co, then we know: --the # and types of phases present.
Cu-Ni system T(°C) • Examples: A T C = 35 wt% Ni A o tie line liquidus L (liquid) At T = 1320°C: 1300 A a + L Only Liquid (L) B T solidus B C = C ( = 35 wt% Ni) L o a a At T = 1190°C: + D L (solid) 1200 D a Only Solid ( ) T D C = C ( = 35 wt% Ni ) a o 32 35 4 3 20 30 40 50 At T = 1250°C: C C C a B L o wt% Ni a Both and L C = C ( = 32 wt% Ni here) L liquidus C = C ( = 43 wt% Ni here) a solidus Phase Diagrams:composition of phases • Rule 2: If we know T and Co, then we know: --the composition of each phase.
Phase Diagrams:weight fractions of phases Cu-Ni system T(°C) A T C = 35 wt% Ni A o tie line liquidus L (liquid) At T : Only Liquid (L) 1300 A a + L B W = 100 wt%, W = 0 a L T solidus B S R a At T : Only Solid ( ) D a a + W = 0, W = 100 wt% a L L (solid) 1200 D T a D At T : Both and L B 32 35 4 3 20 3 0 4 0 5 0 S = WL C C C a L o wt% Ni R + S R = = 27 wt% Wa R + S • Rule 3: If we know T and Co, then we know: --the amount of each phase (given in wt%). • Examples:
T(°C) tie line liquidus L (liquid) 1300 a + L B solidus T B a a + L (solid) 1200 S R 20 3 0 4 0 5 0 C C C a L o wt% Ni The Lever Rule • Tie line – connects the phases in equilibrium with each other - essentially an isotherm How much of each phase? Think of it as a lever M ML R S
Cooling in a Cu-Ni Binary T(°C) L: 35wt%Ni L (liquid) Cu-Ni system a 130 0 A + L L: 35 wt% Ni B a: 46 wt% Ni 35 46 C 32 43 D L: 32 wt% Ni 24 36 a a : 43 wt% Ni + 120 0 E L L: 24 wt% Ni a : 36 wt% Ni a (solid) 110 0 35 20 3 0 4 0 5 0 wt% Ni C o • Phase diagram: Cu-Ni system. • System is: --binary i.e., 2 components: Cu and Ni. --isomorphous i.e., complete solubility of one component in another; a phase field extends from 0 to 100 wt% Ni. • Consider Co = 35 wt%Ni.
Cored vs Equilibrium Phases Uniform C : a a First to solidify: 35 wt% Ni 46 wt% Ni a Last to solidify: < 35 wt% Ni • Ca changes as we solidify. • Cu-Ni case: First a to solidify has Ca = 46 wt% Ni. Last a to solidify has Ca = 35 wt% Ni. • Fast rate of cooling: Cored structure • Slow rate of cooling: Equilibrium structure
Mechanical Properties:Cu-Ni System • Effect of solid solution strengthening on: --Tensile strength (TS) --Ductility (%EL,%AR) 60 %EL for pure Cu 400 %EL for 50 pure Ni TS for Elongation (%EL) 40 pure Ni Tensile Strength (MPa) 300 30 TS for pure Cu 200 20 0 20 40 60 80 100 0 20 40 60 80 100 Cu Ni Cu Ni Composition, wt% Ni Composition, wt% Ni --Peak as a function of Co --Min. as a function of Co
Binary-Eutectic Systems Cu-Ag system T(°C) 1200 L (liquid) 1000 a L + a b L + 779°C b 800 TE 8.0 71.9 91.2 600 a + b 400 200 80 100 0 20 40 60 CE Co , wt% Ag • Eutectic transition L(CE) (CE) + (CE) Ex.: Cu-Ag system • 3 single phase regions a, b (L, ) • Limited solubility: a : mostly Cu b : mostly Ag • TE : No liquid below TE • CE : Min. melting TE composition
EX: Pb-Sn Eutectic System (1) Pb-Sn system T(°C) 300 L (liquid) a L + a b b L + 200 183°C 18.3 61.9 97.8 C- CO 150 S R S = W = a R+S C- C 100 a + b 99 - 40 59 = = = 67 wt% 99 - 11 88 100 0 11 20 60 80 99 40 CO - C R W C C Co = = C, wt% Sn C - C R+S 40 - 11 29 = = 33 wt% = 99 - 11 88 • For a 40 wt% Sn-60 wt% Pb alloy at 150°C, find... --the phases present: a + b --compositions of phases: CO = 40 wt% Sn Ca = 11 wt% Sn Cb = 99 wt% Sn --the relative amount of each phase:
EX: Pb-Sn Eutectic System (2) Pb-Sn system T(°C) CL - CO 46 - 40 = W = a CL - C 46 - 17 300 L (liquid) 6 a L + = = 21 wt% 29 220 a b b R L + S 200 183°C 100 a + b 100 17 46 0 20 40 60 80 C CL Co C, wt% Sn CO - C 23 = W = = 79 wt% L CL - C 29 • For a 40 wt% Sn-60 wt% Pb alloy at 220°C, find... --the phases present: a + L --compositions of phases: CO = 40 wt% Sn Ca = 17 wt% Sn CL = 46 wt% Sn --the relative amount of each phase:
Microstructures in Eutectic Systems: I T(°C) L: Cowt% Sn 400 L a L 300 L a + a 200 (Pb-Sn a: Cowt% Sn TE System) 100 b + a 0 10 20 30 Co , wt% Sn Co 2 (room T solubility limit) • Co < 2 wt% Sn • Result: --at extreme ends --polycrystal of a grains i.e., only one solid phase.
Microstructures in Eutectic Systems: II L: Co wt% Sn T(°C) 400 L L 300 a L + a a: Cowt% Sn a 200 TE a b 100 b + a Pb-Sn system 0 10 20 30 Co , wt% Sn Co 2 (sol. limit at T ) 18.3 room (sol. limit at TE) • • 2 wt% Sn < Co < 18.3 wt% Sn • • Result: • Initially liquid + • then alone • finally two phases • a polycrystal • fine -phase inclusions
Microstructures in Eutectic Systems: III Micrograph of Pb-Sn T(°C) eutectic L: Co wt% Sn microstructure 300 L Pb-Sn system a L + a b L 200 183°C TE 100 160m a : 97.8 wt% Sn : 18.3 wt%Sn 0 20 40 60 80 100 97.8 18.3 CE C, wt% Sn 61.9 • Co = CE • Result: Eutectic microstructure (lamellar structure) --alternating layers (lamellae) of a and b crystals.
Microstructures in Eutectic Systems: IV • Just above TE : L T(°C) L: Co wt% Sn a C = 18.3 wt% Sn a L a CL = 61.9 wt% Sn 300 L Pb-Sn system S W a L + a = 50 wt% = R + S a b WL = (1- W ) = 50 wt% b L + a R S 200 TE S R • Just below TE : C = 18.3 wt% Sn a a b 100 + C = 97.8 wt% Sn a b primary a eutectic S W b a = 73 wt% = eutectic R + S 0 20 40 60 80 100 W = 27 wt% b 18.3 61.9 97.8 Co, wt% Sn • 18.3 wt% Sn < Co < 61.9 wt% Sn • Result:a crystals and a eutectic microstructure
Hypoeutectic & Hypereutectic hypoeutectic: Co = 50 wt% Sn hypereutectic: (illustration only) eutectic: Co=61.9wt% Sn a b a b b a a b a b b a 175 mm 160 mm eutectic micro-constituent 300 L T(°C) a L + a b b L + (Pb-Sn 200 TE System) a + b 100 Co, wt% Sn 0 20 40 60 80 100 eutectic 61.9
Intermetallic Compounds Mg2Pb Note: intermetallic compound forms a line - not an area - because stoichiometry (i.e. composition) is exact.
cool cool cool heat heat heat • Eutectoid - solid phase in equation with two solid phases S2S1+S3 + Fe3C (727ºC) intermetallic compound - cementite • Peritectic - liquid + solid 1 solid 2 S1 + LS2 + L (1493ºC) Eutectoid & Peritectic • Eutectic - liquid in equilibrium with two solids L +
Peritectic transition + L Eutectoid transition + Eutectoid & Peritectic Cu-Zn Phase diagram
T(°C) 1600 d -Eutectic (A): L 1400 Þ g + L Fe3C g +L g A 1200 L+Fe3C 1148°C -Eutectoid (B): (austenite) R S g Þ a + Fe3C g g 1000 g +Fe3C g g a Fe3C (cementite) + 800 B g a 727°C = T eutectoid R S 600 a +Fe3C 400 0 1 2 3 4 5 6 6.7 4.30 0.76 Co, wt% C (Fe) 120 mm Fe3C (cementite-hard) Result: Pearlite = alternating layers of eutectoid a (ferrite-soft) a and Fe3C phases C Iron-Carbon (Fe-C) Phase Diagram • 2 important points
Ferrite and Austenite Austenite Ferrite
T(°C) 1600 d L 1400 (Fe-C g +L g g g System) 1200 L+Fe3C 1148°C (austenite) g g g 1000 g g +Fe3C g g Fe3C (cementite) r s 800 a g g 727°C a a a g g R S 600 a +Fe3C w = s /( r + s ) a w = (1- w ) g a 400 0 1 2 3 4 5 6 6.7 a Co, wt% C (Fe) C0 0.76 pearlite w = w g pearlite Hypoeutectoid 100 mm w = S /( R + S ) a steel w = (1- w ) a Fe3C pearlite proeutectoid ferrite Hypoeutectoid Steel
T(°C) 1600 d L 1400 (Fe-C g +L g g g System) 1200 L+Fe3C 1148°C g g (austenite) g 1000 g g +Fe3C g g Fe3C (cementite) Fe3C s r 800 g g a g g R S 600 a +Fe3C w = r /( r + s ) Fe3C w =(1- w ) g Fe3C 400 0 1 2 3 4 5 6 6.7 Co, wt%C (Fe) pearlite w = w g pearlite w = S /( R + S ) a Hypereutectoid 60mm steel w = (1- w ) a Fe3C pearlite proeutectoid Fe3C Hypereutectoid Steel Co 0.76
Example: Phase Equilibria For a 99.6 wt% Fe-0.40 wt% C at a temperature just below the eutectoid, determine the following • composition of Fe3C and ferrite () • the amount of carbide (cementite) in grams that forms per 100 g of steel • the amount of pearlite and proeutectoid ferrite ()
CO = 0.40 wt% CCa = 0.022 wt% CCFe C = 6.70 wt% C 3 1600 d L 1400 T(°C) g +L g 1200 L+Fe3C 1148°C (austenite) 1000 g +Fe3C Fe3C (cementite) 800 727°C R S 600 a +Fe3C 400 0 1 2 3 4 5 6 6.7 CO C Co, wt% C CFe C 3 Chapter 9 – Phase Equilibria a) composition of Fe3C and ferrite () Solution: • the amount of carbide (cementite) in grams that forms per 100 g of steel
1600 d L 1400 T(°C) g +L g 1200 L+Fe3C 1148°C (austenite) 1000 g +Fe3C Fe3C (cementite) 800 727°C R S pearlite = 51.2 gproeutectoid = 48.8 g 600 a +Fe3C 400 CO 0 1 2 3 4 5 6 6.7 C C Co, wt% C Chapter 9 – Phase Equilibria • the amount of pearlite and proeutectoid ferrite () note: amount of pearlite = amount of g just above TE Co = 0.40 wt% CCa = 0.022 wt% CCpearlite = C = 0.76 wt% C
Alloying Steel with More Elements • Teutectoid changes: • Ceutectoid changes: (wt%C) Ti Si Mo (°C) Ni W Cr Cr eutectoid Eutectoid Si Mn W Mn Ti Mo C T Ni wt. % of alloying elements wt. % of alloying elements
Summary • Phase diagrams are useful tools to determine: --the number and types of phases, --the wt% of each phase, --and the composition of each phase for a given T and composition of the system. • Alloying to produce a solid solution usually --increases the tensile strength (TS) --decreases the ductility. • Binary eutectics and binary eutectoids allow for a range of microstructures.