Download
1 / 3
30 likes | 146 Views
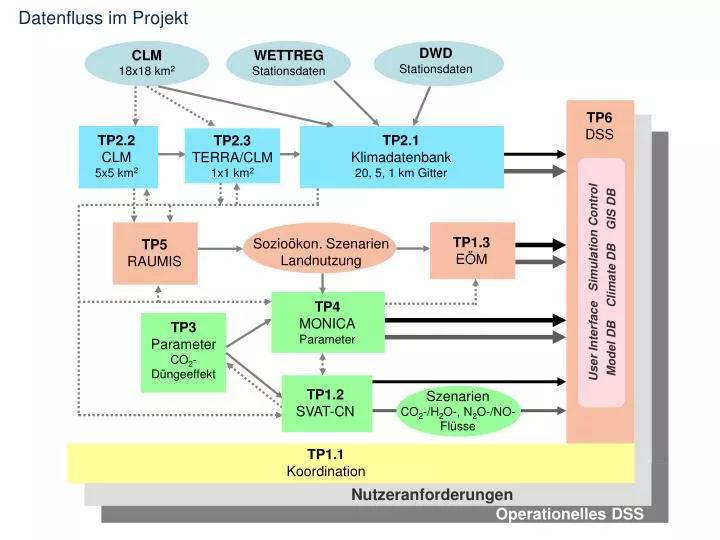
DWD Stationsdaten. WETTREG Stationsdaten. CLM 18x18 km 2. TP2.2 CLM 5x5 km 2. TP2.1 Klimadatenbank 20, 5, 1 km Gitter. TP5 RAUMIS. TP1.3 EÖM. Sozioökon. Szenarien Landnutzung. TP4 MONICA Parameter. TP3 Parameter CO 2 -Düngeeffekt. Datenfluss im Projekt. TP6 DSS. TP2.3

E N D
DWD Stationsdaten WETTREG Stationsdaten CLM 18x18 km2 TP2.2 CLM 5x5 km2 TP2.1 Klimadatenbank 20, 5, 1 km Gitter TP5 RAUMIS TP1.3 EÖM Sozioökon. Szenarien Landnutzung TP4 MONICA Parameter TP3 Parameter CO2-Düngeeffekt Datenfluss im Projekt TP6 DSS TP2.3 TERRA/CLM 1x1 km2 User Interface Simulation ControlModel DB Climate DB GIS DB TP1.2 SVAT-CN Szenarien CO2-/H2O-, N2O-/NO-Flüsse TP1.1 Koordination TP1.1 Nutzeranforderungen Operationelles DSS
Primärproduktion (Wald, Grasland) Biomassezuwachs Ernteertrag Pflanzenproduktionund Produktionspotenziale FACE-Experimente Ableitung von Modellparametern Berücksichtigung des CO2-Düngeeffektes Wassernutzungseffizienz Treibhausgasemission Nitrataustrag Grundwasserspende Bodenerosion Schaderreger Phänologie Artenspektrum (Pflanzen, Vögel) Standortpotenzial Ökologische Indikatoren zu kurz- bis längerfristigen Veränderungen von Standortbedingungen www.landcare2020.de www.landcare2020.de TP1.2 Ökol. IndikatorenTP3 Prozessstudien TP4 Modellplattform Aufgaben und Ziele
www.landcare2020.de www.landcare2020.de TP1.2 Ökol. IndikatorenTP3 Prozessstudien TP4 Modellplattform Zielgrößen Modellfamilien SVAT-CN, PnET, N-DNDC (fertige Szenarien, Prüfwerkzeug, Ableitung von Algorithmen) Primärproduktion, Transpiration, H-/LE-Flüsse, Pflanzen-/, Bodenatmung, NO-/N2O-Emission, Wassernutzungseffizienz Biomassezuwachs, Ernteertrag, Wasserflüsse, Wassernutzungseffizienz, Nitrataustrag, N-Effizienz, N2O?, Grundwasserspende SVAT-Modell MONICA Statist. Ertragsmodell: YIELDSTAT + Grünlandmodell Biomassezuwachs, Ernteertrag Boden, Wassererosion, Winderosion? Erosionsmodell RUSLE Schaderreger (LfL), Phänologie (HUB) Agrarmeteorol., statistische Modelle Pflanzen- und Vogelarten Habitatmodelle, BERN, Terra Botanica Klimaökologische Indizes, neue Algorithmen Klimabedingte Änderungen des Standortpotenzials