Download
1 / 109
1.13k likes | 1.5k Views
Body Composition and Nutrition for Health. Objectives. Identify the U.S. Dietary Goals relative to (a) carbohydrates and fats as a percent of energy intake, (b) salt and cholesterol, and (c) saturated and unsaturated fats. Contrast the Dietary Goals with the Dietary Guidelines.

E N D
Objectives • Identify the U.S. Dietary Goals relative to (a) carbohydrates and fats as a percent of energy intake, (b) salt and cholesterol, and (c) saturated and unsaturated fats. • Contrast the Dietary Goals with the Dietary Guidelines. • Describe what is meant by the terms Recommended Dietary Allowance (RDA) and Dietary Reference Intakes (DRIs), and how they relate to the Daily Value (DV) used in food labeling. • List the classes of nutrients.
Objectives • Identify the fat- and water-soluble vitamins, describe what toxicity is, and identify which class of vitamins is more likely to cause this problem. • Contrast major minerals with trace minerals, and describe the role of calcium, iron, and sodium in health and disease. • Identify the primary role of carbohydrates, two major classes, and the recommended changes in the American diet to improve health status. • Identify the primary role of fat and the recommended changes in the American diet to improve health status.
Objectives • List the food groups represented in the MyPyramid eating plan. • Describe the Dietary Approaches to Stop Hypertension (DASH) eating plan, and describe similarities to the MyPyramid plan. • Describe the limitation of the height/weight table in determining overweight and obesity.
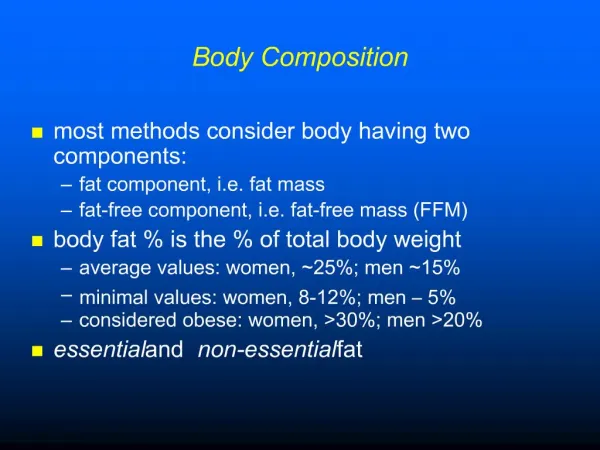
Objectives • Provide a brief description of the following methods of measuring body composition: isotope dilution, photon absorptiometry, potassium-40, hydrostatic (underwater weighing), dual energy x-ray absorptiometry, near infrared interactance, radiography, ultrasound, nuclear magnetic resonance, total body electrical conductivity, bioelectrical impedance analysis, air displacement plethysmography, and skinfold thickness. • Describe the two-component model of body composition and the assumptions made about the density values for the fat-free mass and the fat mass; contrast this with the multicomponent model.
Objectives • Explain the principle underlying the measurement of whole-body density with underwater weighing, and why one must correct for residual volume. • Explain why there is an error of ±2.0% in the calculation of percent body fat with the underwater weighing technique. • Explain how a sum of skinfolds can be used to estimate a percent body fatness value. • List the recommended percent body fatness values for health and fitness for males and females, and explain the concern for both high and low values.
Objectives • Discuss the reasons why the average weight at any height (fatness) has increased while deaths from cardiovascular diseases have decreased. • Distinguish between obesity due to hyperplasia of fat cells and that due to hypertrophy of fat cells. • Describe the roles of genetics and environment in the development of obesity. • Explain the set point theory of obesity, and give an example of a physiological and behavioral control system. • Describe the pattern of change in body weight and caloric intake over the adult years.
Objectives • Discuss the changes in body composition when weight is lost by diet alone versus diet plus exercise. • Describe the relationship of the fat-free mass and caloric intake to the BMR. • Define thermogenesis and explain how it is affected by both short- and long-term overfeeding. • Describe the effect of exercise on appetite and body composition. • Explain quantitatively why small differences in energy expenditure and dietary intake are important in weight gain over the years.
Nutritional Goals Standards of Nutrition Classes of Nutrients Water Vitamins Minerals Carbohydrates Fats Protein Meeting the Guidelines and Achieving the Goals Food Group Plans Evaluating the Diet Outline • Obesity and Weight Control Obesity • Diet, Exercise, and Weight Control Energy and Nutrient Balance Diet and Weight Control Energy Expenditure and Weight Control • Body Composition Methods of Assessing Overweight and Obesity Methods of Measuring Body Composition Two-Component System of Body Composition Body Fatness for Health and Fitness
Nutritional Goals U.S. Dietary Goals (1977) • Increase carbohydrate intake to 55–60% total calories • Decrease fat intake to less than 30% total calories • Decreased saturated fat to less than 10% total calories • Increase polyunsaturated and monounsaturated fat to 10% of caloric intake • Decrease dietary cholesterol to 300 mg per day • Reduce sugar consumption to 15% total calories • Decrease salt intake to 3 grams per day
Nutritional Goals Meeting the U.S. Dietary Goals • Increase intake of fruits, vegetables, and whole grains • Increase consumption of poultry and fish • Decrease intake of meat • Decrease intake of foods high in fat • Substitute polyunsaturated fat for saturated fat • Substitute nonfat milk for whole milk • Decrease consumption of butter, fat, eggs, and other high-cholesterol foods • Decrease consumption of sugar and foods high in sugar • Decrease consumption of salt and foods high in salt
Nutritional Goals Dietary Guidelines for Americans (1980) • Did not provide specific quantities to achieve for fat, cholesterol, salt, and carbohydrates • More general statements for good health
Nutritional Goals Institute of Medicine Dietary Recommendations (2002) • 45–65% calories from carbohydrates • 20–35% calories from fat • Infants and younger children need higher proportion of fat (25–40%) • 10–35% from protein
Nutritional Goals Dietary Guidelines for Americans (2005) • Consume a variety of nutrient-dense foods and beverages within and among the basic food groups • Choose foods that limit the intake of saturated and trans fats, cholesterol, added sugars, salt, and alcohol • Maintain body weight in a health range • Balance calories from foods and beverages with calories expended • Engage in regular physical activity and reduce sedentary activities
Nutritional Goals Clinical Applications 18.1Institute of Medicine Report • Established RDA for carbohydrate • 130 g/day (meets glucose needs of brain) • AI (adequate intake) for fiber set • 38 g/day (men) and 25 g/day (women) • AI for linoleic acid (omega-6 fatty acid) • 17 g/day (men) and 12 g/day (women) • AI for -linolenic acid (omega-3 fatty acid) • 1.6 g/day (men) and 1.1 g/day (women) • Maintained adult protein requirement • 0.8 g/kg body weight/day • AI for water set • 3.7 L/day (men) and 2.7 L/day (women)
Nutritional Goals In Summary • Current recommendations for the distribution of calories in foods include a broad range, rather than a single goal: carbohydrates: 45% to 65%, fats: 20% to 35%, and proteins: 10% to 35%. • The publication, Dietary Guidelines for Americans, has been revised over time to reflect new science and to deal with nutrition (and physical activity) and health-related issues. The 2005 edition provides recommendations to meet the new nutritional standards with special focus on achieving energy balance.
Standards of Nutrition Dietary Reference Intakes (DRIs) • Quantity of nutrients needed for proper function and health • Recommended Daily Allowances (RDA) • Quantity of each nutrient to meet the needs of nearly all (97–98%) healthy persons • Adequate Intakes (AI) • Recommended daily intake based on apparently healthy people • Tolerable Upper Intake Level (UL) • The highest intake level that is likely to pose no risk • Estimated Average Requirement (EAR) • The intake estimated to meet requirements of half of healthy people
Standards of Nutrition Standards of Nutrition • Estimated Energy Requirement (EER) • Average dietary energy intake predicted to maintain energy balance considering age, gender, weight, height, and level of physical activity • Daily Value (DV) • Standard used in nutritional labeling • Percentage of recommended intake in each serving • Based on a 2,000 kcal•day–1 diet
Standards of Nutrition Nutritional Labeling • Food labels contain: • Serving size information • Total calories and fat calories • Total fat grams, saturated fat grams, cholesterol, and the %DV for each • Based on a 2,000-calorie diet • Total carbohydrate and its sources • Percent of DV for vitamins and minerals • Sodium is given special attention
Standards of Nutrition Example of a Food Label Figure 18.1
Standards of Nutrition In Summary • The Recommended Dietary Allowance (RDA) is the quantity of a nutrient that will meet the needs of almost all healthy persons. • The Daily Value (DV) is a standard used in nutritional labeling.
Classes of Nutrients Water • Absolutely essential for life • Loss of only 3–4% body water affects performance • Water loss • Normally ~2500 ml per day • Temperature and exercise can increase water loss to 6–7 liters per day • Water intake • Beverages (1500 ml) • Solid food (750 ml) • Metabolic processes (250 ml) • AI is 2.7 L/day (women), 3.7 L/day (men)
Classes of Nutrients Vitamins • Fat-soluble vitamins • A, D, E, K • Can be stored in the body • Excess intake can be toxic • Water-soluble vitamins • B vitamins • Thiamin (B-1), riboflavin (B-2), niacin, pyroxidine (B-6), folic acid, B-12, pantothenic acid, and biotin • Involved in energy metabolism • Vitamin C • Maintenance of bone, cartilage, and connective tissue
Classes of Nutrients Summary of the Fat-Soluble Vitamins
Classes of Nutrients Summary of the Water-Soluble Vitamins
Classes of Nutrients In Summary • The fat-soluble vitamins include A, D, E, and K. These can be stored in the body in large quantities, and a toxicity can develop. • The water-soluble vitamins include thiamin, riboflavin, niacin, B6, folic acid, B12, pantothenic acid, biotin, and C. Most of these are involved in energy metabolism. Vitamin C is involved in the maintenance of bone, cartilage, and connective tissue.
Major minerals Calcium Sodium Phosphorus Magnesium Sulfur Potassium Chloride Trace elements Iron Iodine Fluoride Zinc Selenium Copper Cobalt Chromium Manganese Molybdenum Arsenic Nickel Vanadium Classes of Nutrients Classes of Nutrients—Minerals • For a summary of minerals, see Table 18.2
Classes of Nutrients Minerals • Calcium • Important in teeth and bone structure • Osteoporosis • Iron • Component of hemoglobin • Anemia • Sodium • Associated with hypertension • In sodium-sensitive individuals
Classes of Nutrients In Summary • The major minerals include calcium, phosphorus, magnesium, sulfur, sodium, potassium, and chloride. The trace elements include iron, iodine, fluoride, zinc, selenium, copper, cobalt, chromium, manganese, molybdenum, arsenic, nickel, and vanadium. • Inadequate calcium and iron intake have been linked with osteoporosis and anemia, respectively. Those with a genetic predisposition for hypertension due to sodium retention benefit from a reduction in salt intake.
Classes of Nutrients Carbohydrates • Sugars and starches • Contain 4 kcal/g • Major energy source • Crucial for red blood cells and neurons • Recommendations • Choose or prepare foods and beverages with little added sugars or caloric sweeteners • Reduce the incidence of dental caries by consuming sugar-containing foods and beverages less frequently
Classes of Nutrients Carbohydrates • Dietary fiber • Non-digestible carbohydrates and lignin • Reduces transit time in intestine • Soluble fiber linked to lower serum cholesterol • Functional fiber • Non-digestible carbohydrates • Have beneficial physiological functions • Recommendations • AI: 38 g/day for men, 25 g/day for women • Increase dietary fiber and complex carbohydrate intake • Decrease simple sugar intake
Classes of Nutrients Clinical Applications 18.2Glycemic Index—What Is It and Is It Important? • Glycemic index (GI) • Blood glucose response (over 2 hours) to carbohydrate food • Low GI foods make blood glucose regulation less challenging • Glycemic load (GL) • Takes into account amount of food eaten • Can be used to plan meals • Improved metabolic control in diabetics • Reduce cholesterol and vascular inflammation • Simplicity complicated by protein and fat in diet
Classes of Nutrients Fats • Important energy source • Contain 9 kcals•gram–1 • Triglycerides • Phospholipids • Cholesterol • Low-density lipoproteins (LDLs) • Directly related to cardiovascular disease risk • Increased by diets high in saturated fat • High-density lipoproteins (HDLs) • Protect against heart disease
Classes of Nutrients Fats • Recommendations • Consume less than 10% calories from saturated fats and less than 300 mg/day cholesterol • Keep total fat intake between 20–35% calories • Most fats should come from polyunsaturated and monounsaturated fats • Choose and prepare meat, poultry, dry beans, milk, and milk products that are lean, low fat, or fat free • Limit intake of fat and oils high in saturated and/or trans fatty acids
Classes of Nutrients Clinical Applications 18.3Diet Composition and Syndrome X • Clustering of risk factors associated with cardiovascular disease risk • Hyperinsulinemia, hyperlipidemia, hypertension, and obesity • Diet composition may be a contributing factor • A high-fat, refined sugar (HFS) diet associated with: • Insulin resistance in elevated plasma insulin • Elevated triglycerides • Larger fat cell size • Higher blood pressure • Compared to low-fat, complex-carbohydrate diet
Classes of Nutrients Proteins • Not a major source of energy • 4 kcals•gram–1 • High-quality proteins contain the nine essential amino acids • Cannot be synthesized by the body • Most Americans meet protein intake requirements • 0.8 grams•kg–1 body weight • Requirements may be higher in athletes
Classes of Nutrients In Summary • Carbohydrate is a primary source of energy in the American diet and is divided into two classes: that which can be metabolized (sugars and starches) and dietary fiber. • Two recommendations to improve health status in the American population are to consume complex carbohydrates to represent about 45% to 65% of the calories, and to add more dietary fiber.
Classes of Nutrients In Summary • Americans consume too much saturated fat, and the recommended change is to reduce this to no more than 10% of the total calories. Trans fat intake should be reduced as much as possible, and most fat intake should come from sources containing polyunsaturated and monounsaturated fatty acids. • The protein requirement of 0.8 g/kg can be met with low-fat selections to minimize fat intake.
Meeting the Guidelines and Achieving the Goals Meeting the Guidelines and Achieving the Goals • The new Dietary Guidelines for Americans describes a healthy diet as one that: • Emphasizes fruits, vegetables, whole grains, and fat-free or low-fat milk and milk products • Includes lean meats, poultry, fish, beans, eggs, and nuts • Is low in saturated fat, trans fat, cholesterol, salt (sodium), and added sugars
Meeting the Guidelines and Achieving the Goals Food Group Plans • Basic Four Food Group Plan • Meat and meat substitutes • Milk and milk products • Fruits and vegetables • Grains (breads and cereals) • Foods should have a high nutrient density • Nutrient content in 1,000 kcal of a food
Meeting the Guidelines and Achieving the Goals MyPyramid (2005) • Revision of 1992 Food Guide Pyramid • Includes major food groups • Grains, vegetables, fruits, milk, and meat & beans • How much of each category needed to meet 2000 kcal/day energy expenditure • Special attention on physical activity • Website provides individualized dietary plan • Based on age, gender, and level of physical activity • Consistent with most dietary recommendations • Should help control health conditions • Vitamin E and potassium intake may be too low
Meeting the Guidelines and Achieving the Goals MyPyramid Food Groups
Meeting the Guidelines and Achieving the Goals Dietary Approaches to Stop Hypertension (DASH) • Developed to prevent hypertension and to lower blood pressure in those with hypertension • Healthy eating approach consistent with good health: • Reducing cardiovascular risk factors • Achieving and maintaining a healthy body weight
Meeting the Guidelines and Achieving the Goals The DASH Eating Plan
Meeting the Guidelines and Achieving the Goals Evaluating the Diet • How well is someone achieving the guidelines? • 24-hour recall method • Remember what you ate the previous 24 hours • Food records • Person records what they eat • Recommended to use 3–4 days in a week
Meeting the Guidelines and Achieving the Goals In Summary • The 2005 Dietary Guidelines for Americans identified two approaches to use to meet dietary standards and achieve a healthy body weight: • The U.S. Department of Agriculture’s MyPyramid promotes a personalized approach to healthy eating and physical activity. It replaced the Food Guide Pyramid. • The Dietary Approaches to Stop Hypertension (DASH) food plan is suitable for all to use in planning a healthy diet, whether one has hypertension or not.
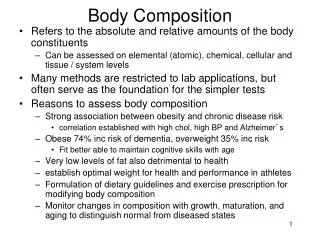
Body Composition Methods of Assessing Overweight and Obesity • Metropolitan Life Insurance height and weight tables • No longer widely used • Body mass index (BMI) • Weight (kg) / height (m2) • Classification for adults • Underweight: BMI <18.5 kg/m2 • Normal: BMI 18.5–24.9 kg/m2 • Overweight: BMI 25.0–29.9 kg/m2 • Obesity: BMI ≥30.0 kg/m2 • No way to tell actual body composition • A very muscular person could be classified as obese
Body Composition Methods of Measuring Body Composition • Isotope dilution • Measurement of total body water • Uses an isotope of water • Photon absorptiometry • Determines mineral content and density of bones • Potassium-40 • Measurement of lean tissue • Hydrostatic (underwater) weighing • Determination of body density • Dual energy X-ray absorptiometry (DEXA) • Estimates lean tissue, bone, mineral, and fat
Body Composition Methods of Measuring Body Composition • Near infrared interactance (NIR) • Uses an infrared light beam • Radiography • Measurement of fat width • Ultrasound • Measures thickness of subcutaneous fat • Nuclear Magnetic Resonance (NMR) • Volumes of specific tissues • Total body electrical conductivity (TOBEC) • Electrical conductivity of lean and fat tissue
Body Composition Methods of Measuring Body Composition • Bioelectrical impedance analysis (BIA) • Measurement of total body water and fatness • Air displacement plethysmography • Measurement of body density • Skinfold thickness • Estimate of total body fatness