Download
1 / 29
290 likes | 452 Views
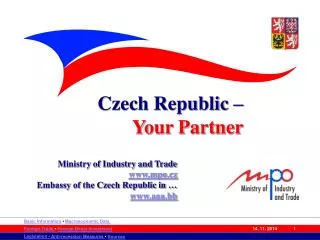
Hungary & the Czech Republic. Kenny Watson May 17, 2005. Czech Republic. Capital: Prague Area: 78,866 sq. km (77,276 land, 1,590 water). Czech Republic. Capital: Prague Area: 78,866 sq. km (77,276 land, 1,590 water). Hungary. Capital: Budapest Area: 93,030 sq. km

E N D
Hungary & the Czech Republic Kenny Watson May 17, 2005
Czech Republic Capital: Prague Area: 78,866 sq. km (77,276 land, 1,590 water)
Czech Republic Capital: Prague Area: 78,866 sq. km (77,276 land, 1,590 water)
Hungary Capital: Budapest Area: 93,030 sq. km (92,340 land, 690 water)
Hungary Capital: Budapest Area: 93,030 sq. km (92,340 land, 690 water)
Population(July 2005 est.) 10,241,138 total populationBirth rate- 9.07 births/1000+Migration rate- 0.97/1000-Death rate- 10.54deaths/1000=Population Growth rate- -0.05%Density/sq mile- 336 10,006,835 total population Birth rate- 9.76 births/1000+ Migration rate- 0.86 /1000 - Death rate- 13.19 deaths/1000 =Population Growth rate- -0.26%Density/sq mile- 279
Population(July 2005 est.) 10,241,138 total populationBirth rate- 9.07 births/1000+Migration rate- 0.97/1000-Death rate- 10.54 deaths/1000=Population Growth rate- -0.05%Density/sq mile- 336 10,006,835 total population Birth rate- 9.76 births/1000+ Migration rate- 0.86 /1000 - Death rate- 13.19deaths/1000 =Population Growth rate- -0.26%Density/sq mile- 279
Demographics(July 2005 est.) Life Expectancy: Overall: 76.02Male: 72.74Female: 79.49Ethnic Groups:Czech, Moravian, Slovak, Polish, German, Silesian, Roma, Hungarian Life Expectancy: Overall: 72.40Male: 68.18Female: 76.89Ethnic Groups:Hungarian, Roma, German, Serb, Slovak, Romanian
Demographics(July 2005 est.) Life Expectancy: Overall: 76.02Male: 72.74Female: 79.49Ethnic Groups:Czech, Moravian, Slovak, Polish, German, Silesian, Roma, Hungarian Life Expectancy: Overall: 72.40Male: 68.18Female: 76.89Ethnic Groups:Hungarian, Roma, German, Serb, Slovak, Romanian
Economic(2004 est.) GDP: $149.3 billionPer Capita: $14,900Growth Rate: 3.9%By SectorAgriculture: 3.3%Industry: 31.4%Services: 65.3%Inflation Rate: 3.2% GDP: $172.2 billionPer Capita: $16,800Growth Rate: 3.7%By Sector Agriculture: 3.4%Industry: 39.3%Services: 57.3% Inflation Rate: 7.0%
Economic(2004 est.) GDP: $149.3 billionPer Capita: $14,900Growth Rate: 3.9%By SectorAgriculture: 3.3%Industry: 31.4%Services: 65.3%Inflation Rate: 3.2% GDP: $172.2 billionPer Capita: $16,800Growth Rate: 3.7%By Sector Agriculture: 3.4%Industry: 39.3%Services: 57.3% Inflation Rate: 7.0%
Economic(2004 est.) GDP: $149.3 billionPer Capita: $14,900Growth Rate: 3.9%By SectorAgriculture: 3.3%Industry: 31.4%Services: 65.3%Inflation Rate: 3.2% GDP: $172.2 billionPer Capita: $16,800Growth Rate: 3.7%By Sector Agriculture: 3.4%Industry: 39.3%Services: 57.3% Inflation Rate: 7.0%
Economic (contd.)(2004 est.) Unemployment Rate: 10.6%BudgetRevenues: $39.31 billionExpenditures: $45.8 billionBalance: -$6.49 billionPublic Debt: 33.5% of GDPAccount Balance: $-5.73 billion Unemployment Rate: 5.9%BudgetRevenues: $45.8 billionExpenditures: $51.36 billion Balance: -$5.56 billion Public Debt: 58.3% of GDPAccount Balance: $-7.94 billion
Economic (contd.)(2004 est.) Unemployment Rate: 10.6%BudgetRevenues: $39.31 billionExpenditures: $45.8 billionBalance: -$6.49 billionPublic Debt: 33.5% of GDPAccount Balance: $-5.73 billion Unemployment Rate: 5.9%BudgetRevenues: $45.8 billionExpenditures: $51.36 billion Balance: -$5.56 billion Public Debt: 58.3% of GDPAccount Balance: $-7.94 billion
bold text = criterion not metSource: HN, Eurostat, Deutsche Bank
Fiscal Policy(2004-2006, in millions) • Structural Funds vs. Cohesion Funds
Fiscal Policy(2004-2006, in millions) • Structural Funds vs. Cohesion Funds
Fiscal Policy(2004-2006, in millions) Total Aid: € 2621.19Cohesion Aid: 936.05Structural Funds: 1685.14 Total Aid: € 3207.36Cohesion Aid: 1112.67Structural Funds: 2094.69
Fiscal Policy(2004-2006, in millions) Total Aid: € 2621.19Cohesion Aid: 936.05Structural Funds: 1685.14 Total Aid: € 3207.36Cohesion Aid: 1112.67Structural Funds: 2094.69
Fiscal Policy(2004-2006, in millions) Total Aid: € 2621.19Cohesion Aid: 936.05Structural Funds: 1685.14 Total Aid: € 3207.36Cohesion Aid: 1112.67Structural Funds: 2094.69
CAP and Fisheries • Substantial progress in some areas • No International Fishery Policies • Fulfilling CAP policies on the whole • Capacity for managing fisheries needs to be strengthened.
CAP and Fisheries • Substantial progress in some areas • No International Fishery Policies • Fulfilling CAP policies on the whole • Capacity for managing fisheries needs to be strengthened
Social Policies • Women’s unemployment low, Men’s employment slightly higher • Unemployment low in due to strong economic growth Employment and unemployment rate by sex (In age between 15 and 74) (%) Source: HCSO
Social Policies • Women’s unemployment low, Men’s employment slightly higher • Unemployment low in due to strong economic growth Employment and unemployment rate by sex (In age between 15 and 74) (%) Source: HCSO
Social Policies • Historically some of the lowest unemployment rates in EC • Men’s unemployment rate around 6.5% for both
Social Policies • Historically some of the lowest unemployment rates in EC • Men’s unemployment rate around 6.5% for both
External Relations • Anti-expansionist • NATO • Trading Partners • Anti-expansionist • NATO • Trading Partners
External Relations • Anti-expansionist • NATO • Trading Partners • Anti-expansionist • NATO • Trading Partners
External Relations • Anti-expansionist • NATO • Trading Partners • Anti-expansionist • NATO • Trading Partners